

Volume 15, Issue 3 (May & June 2025)
J Research Health 2025, 15(3): 293-302 |
Back to browse issues page


Download citation:
BibTeX | RIS | EndNote | Medlars | ProCite | Reference Manager | RefWorks
Send citation to:


BibTeX | RIS | EndNote | Medlars | ProCite | Reference Manager | RefWorks
Send citation to:
Vishwakarma M, Tyagi G, Kumar Dubey P. Child Undernutrition: Spatial Heterogeneity and Determinants in Low Sociodemographic Index States of India. J Research Health 2025; 15 (3) :293-302
URL: http://jrh.gmu.ac.ir/article-1-2614-en.html
URL: http://jrh.gmu.ac.ir/article-1-2614-en.html


1- Department of Mathematics and Statistics, Banasthali Vidyapith, Tonk, India. , vishwakarma.m96@gmail.com
2- Department of Mathematics and Statistics, Banasthali Vidyapith, Tonk, India.
3- Monitoring & Evaluation, India Health Action Trust, Lucknow, India.
2- Department of Mathematics and Statistics, Banasthali Vidyapith, Tonk, India.
3- Monitoring & Evaluation, India Health Action Trust, Lucknow, India.
Keywords: Under-five children, Stunting, Wasting, Underweight, Spatial lag model, local indicator of spatial association (LISA)
Full-Text [PDF 2483 kb]
(888 Downloads)
| Abstract (HTML) (3833 Views)
Full-Text: (755 Views)
Introduction
Undernutrition is a health issue that occurs when there is insufficient food consumption or when the body is unable to adequately utilize the food that is consumed. This can lead to stunted growth, being underweight, or wasting of the body. It has a global impact on over 149 million children under the age of five [1]. Stunting, wasting, and underweight are standard indices used to quantify undernutrition; these indices represent distinct aspects of undernutrition. Lack of proper nutrition can have detrimental effects on one’s health, particularly for children in developing nations. This condition is known as undernutrition [2].
Malnutrition in childhood accounts for a significant portion of child deaths under the age of five, and it is particularly common in developing nations. With high prevalence rates of stunting, wasting, and underweight among children under five, malnutrition is a serious public health issue [3, 4]. The prevalence of malnutrition among under-five children is high globally, with South Asia having a particularly high prevalence [5]. Although India has experienced economic development and a decrease in poverty, the prevalence of malnutrition remains significant. The prevalence of underweight decreased from 53% to 36%, stunting decreased from 52% to 38%, whereas wasting increased from 17% to 21% [6].
Between 2005–06 and 2015–16, India made a modest decrease in the prevalence of stunting and underweight in children under five years, but the progress is insufficient compared to its economic growth. Although there was a moderate decline in child undernutrition during this period, over one-third of children under five years old remain stunted and underweight [7]. Addressing poverty, enhancing education and healthcare, increasing sanitation, and promoting understanding about child feeding may successfully reduce malnutrition in India [8].This situation of undernutrition in India is quite evident in highly populated regions, namely Uttar Pradesh, Bihar, Rajasthan, Madhya Pradesh, etc. These states also rank at the lower end of socio-demographic index (SDI) paradigm. The SDI is a composite index of development that is significantly associated with health impact. It represents the geometric mean of the indices ranging from zero to one for mean education among individuals aged 15 or older (EDU15+), total fertility rate under 25 (TFU25), and lag distributed income (LDI) per capita. A location with an SDI of zero has a theoretical minimal level of health-related development, whereas a location with an SDI of one has a theoretical maximum level [9].The SDI quantiles are utilized for classification. Based on their SDI, the states Uttar Pradesh, Bihar, Rajasthan, Madhya Pradesh, Chhattisgarh, and Jharkhand fall into the category of low socio-demographic index (LSDI)states. Recent advancements in public health research indicate that geospatial mapping and modeling of various demographic and epidemiological events, by integrating different exposure factors, are instrumental in identifying specific areas of concern. This approach enhances the accuracy of resource allocation, aiding government and policymakers in addressing community needs more effectively. Hence, this study aimed to identify spatial clustering and autocorrelation of child undernutrition at the district level, as well as to identify the spatially associated determinants of child undernutrition.
Methods
Data
Children’s recode (KR) data used in this study were obtained from the recently conducted national family health survey (NFHS- 5), 2019-21. This dataset has one record for every child of interviewed women, born in the five years preceding the survey. Unit-level data is accessible through the demographic health survey (DHS) data repository [10]. The unit of analysis in this research is the districts of LSDI states in India, which comprise 248 districts, including a total of 104692 children under the age of five years at the time of survey. A total of 81278 children was included in the final analysis sample, after removing missing values from one or more variables under consideration [11]. This study focused on three anthropometric indicators that assess the nutritional status of under-five children: Stunting (height-for-age), underweight (weight-for-age), and wasting (weight-for-height). These indicators serve as the target variables in our investigation and are widely utilized in academic literature as standardized measures of children’s nutritional well-bein [12, 13]. Underweight denotes both acute and chronic forms of malnutrition, stunting represents chronic malnourishment while wasting in children denotes acute malnutrition [14]. The independent variables included place of residence, maternal education, improved drinking water, sanitation facility, religion, caste, wealth index, maternal BMI, maternal anemia, birth order, institutional birth, infectious disease in the past two weeks, and whether the child was put on the mother’s chest immediately after birth.
Statistical analysis
Descriptive statistics, univariate local Moran’s I statistics, and a set of spatially weighted regression models were used in this study. The univariate local indicator of spatial association (LISA) maps were used to assess the association between neighborhood values surrounding a certain spatial location. This method quantifies the level of geographical randomization and clustering in the data. The values of Moran’s I can range from -1 to +1; clustering of similar values is indicated by positive values, while dissimilar values are indicated by negative values. If the value is zero, it indicates the absence of spatial autocorrelation, and the pattern is completely random [15-19]. A typical Moran’s I formula can be expressed as follows (Equation 1):
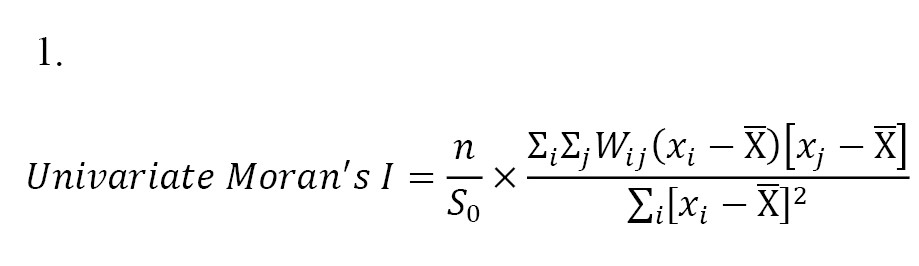
Where, x is the target variable, X̅ is the average value of x; n represents the number of spatial units, Wij represents the standardized weight matrix between observations i and j (with zeroes along the diagonal), and S0 is the total of all spatial weights, i.e. S0=∑i ∑j Wij
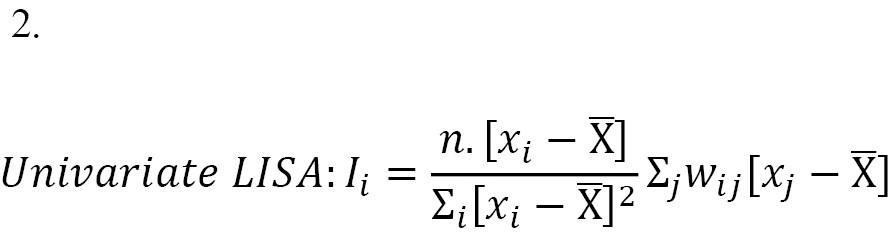
The univariate LISA method computes spatial autocorrelation of neighboring values at a particular spatial location. It assesses the degree of spatial randomness and clustering within the data [18]. The measure Ii is defined as follows: The univariate LISA method computes spatial autocorrelation of neighboring values at a particular spatial location. It assesses the degree of spatial randomness and clustering within the data [18]. The measure [Ii] is defined as follows (Equation 2):
To identify probable spatial correlates of undernutrition, a set of regression models was utilized to provide the best fit to the data and comprehend the relationships involved. Initially, we employed K-Best feature selection techniques to identify the most important features in the dataset, providing insights into the underlying relationships between the features and the target variable.
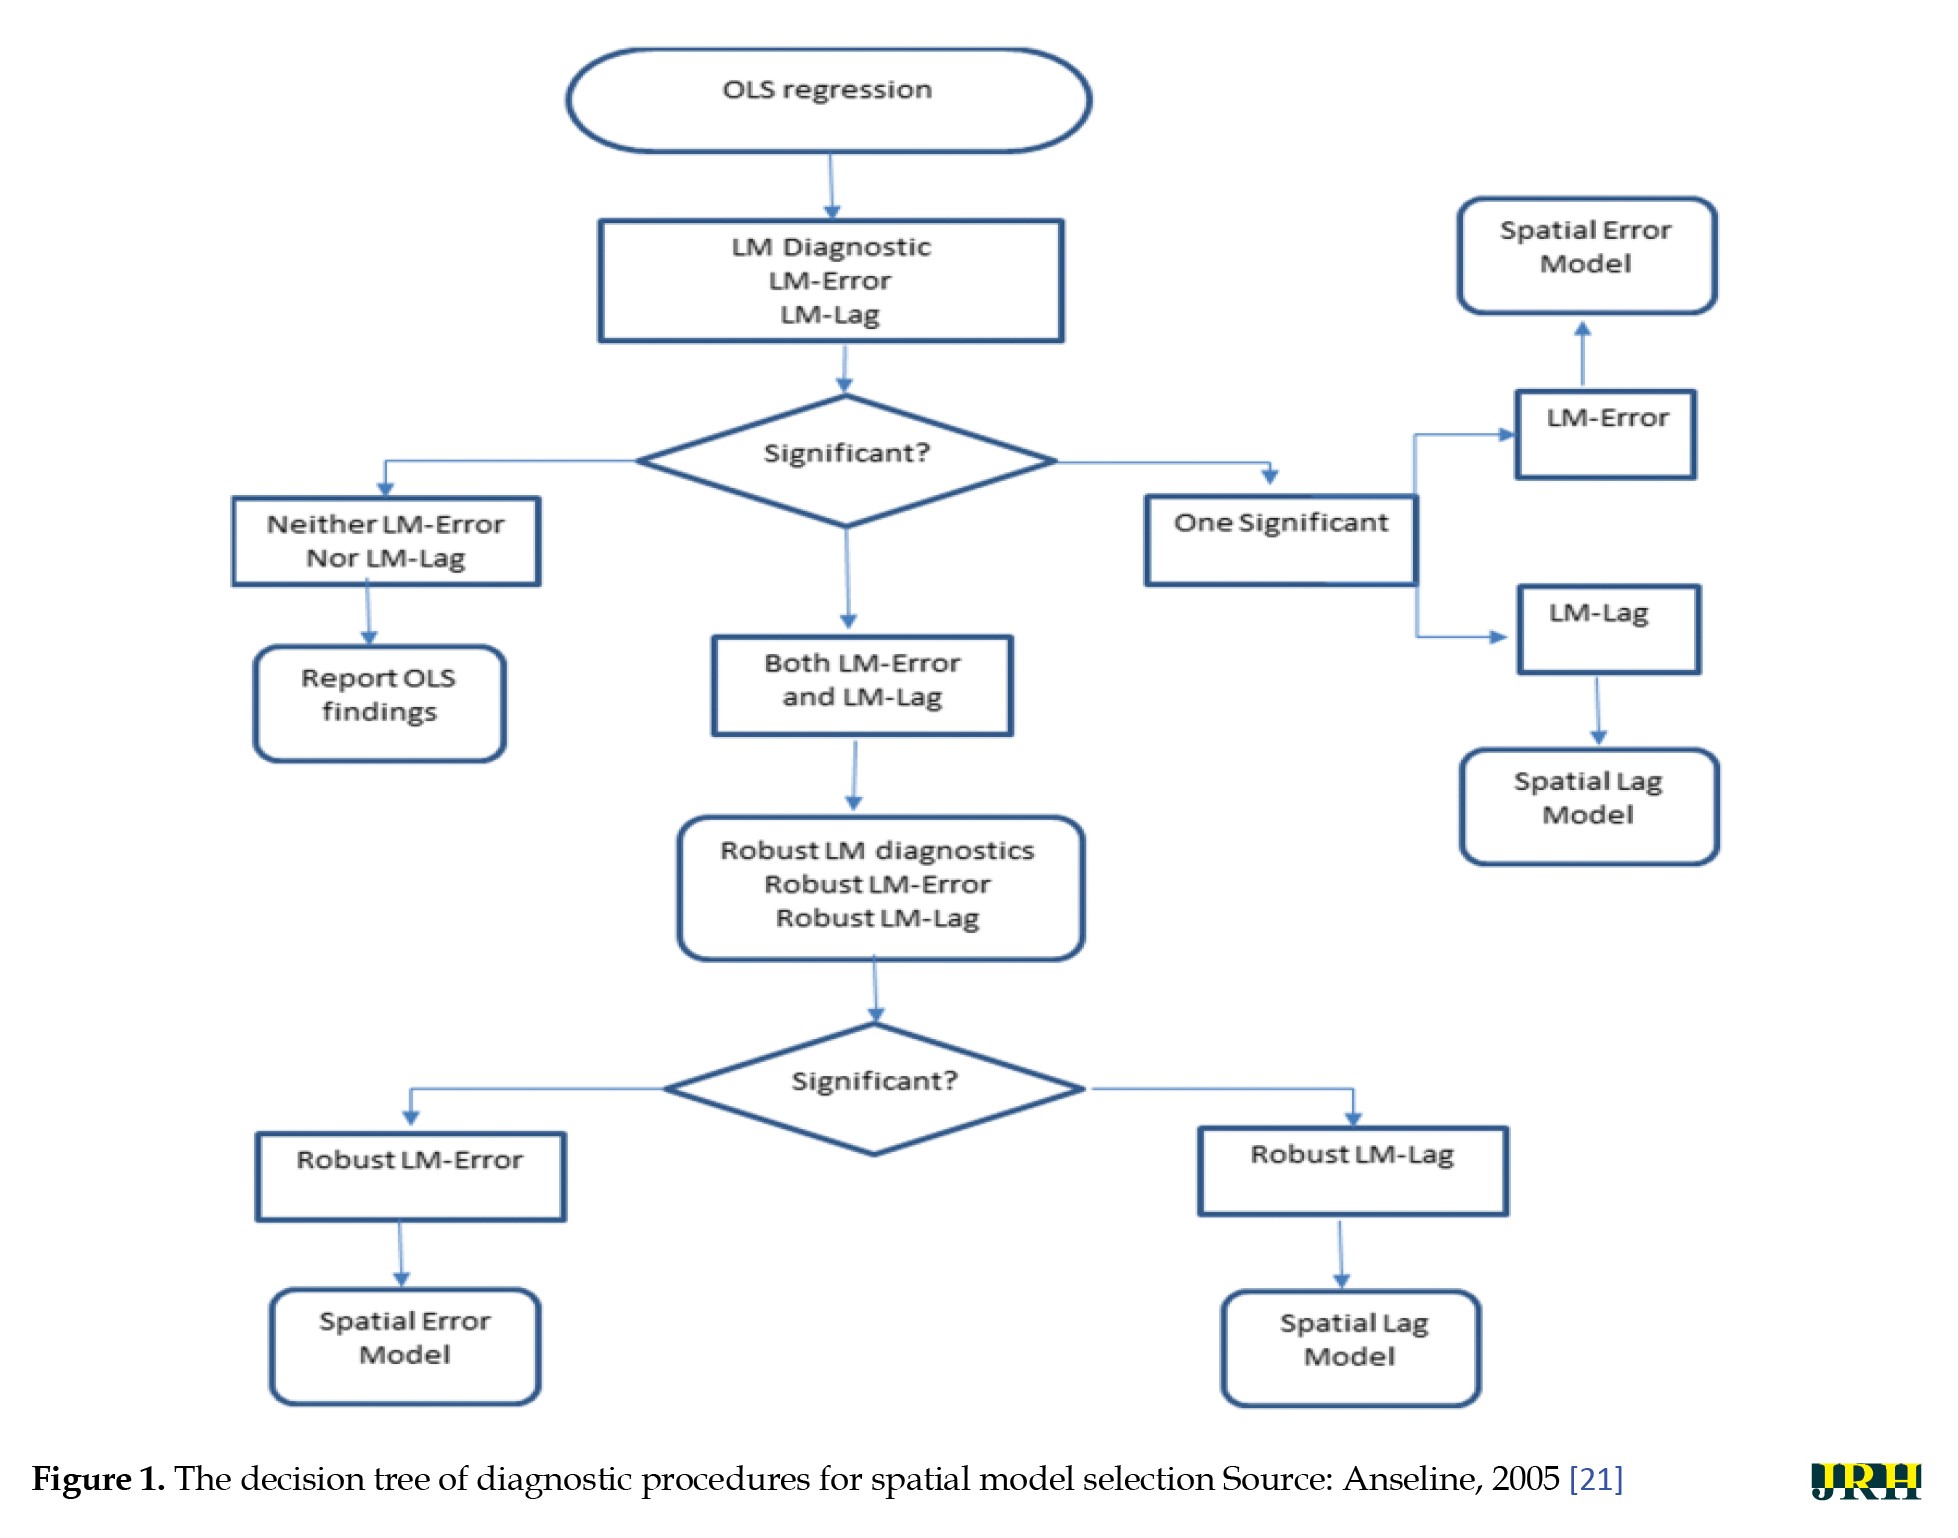
Next, the ordinary least squares (OLS) method has been employed with each outcome variable (stunting, wasting, and underweight) and various selected important features to estimate the presence of spatial autocorrelation in the error term and to calculate the corresponding Moran’s I statistics. Subsequently, LM Diagnostics are instituted post-OLS regression to subject the model to rigorous statistical scrutiny, specifically to identify potential misspecification [20]. A consequential examination for significance follows: If neither LM-error nor LM-lag proves significant, the analysis halts, retaining the OLS outcomes. Conversely, if there is significance in either LM-error or LM-lag, the analytical trajectory pivots toward the relevant error or lag model. In instances where both LM-error and LM-lag exhibit significance, further diagnostic scrutiny becomes imperative to inform subsequent decisions. Robust LM diagnostics are subsequently deployed, differentiating between robust LM-error and robust LM-lag. The conclusive step involves the implementation of the appropriate model—either the spatial error model or the spatial lag model—based on the discerned diagnostic outcomes (Figure 1) [21].
 In accordance with the model diagnostics test, for all three types of child undernutrition—stunting, wasting, and underweight—the spatial lag model performed better with the data than the other models given [Table 2].
A trial version of Arc-GIS 10.1 (Esri, California), R Studio version 2023.12.1+402 (2009–2024 Posit Software, PBC), and Geo-Da version 1.20.0.36 (2011-2023 by Luc Anselin) was used for the analysis. All estimates in this study relied on appropriate sampling weights given by the NFHS-5, 2019-21 [10].
Results
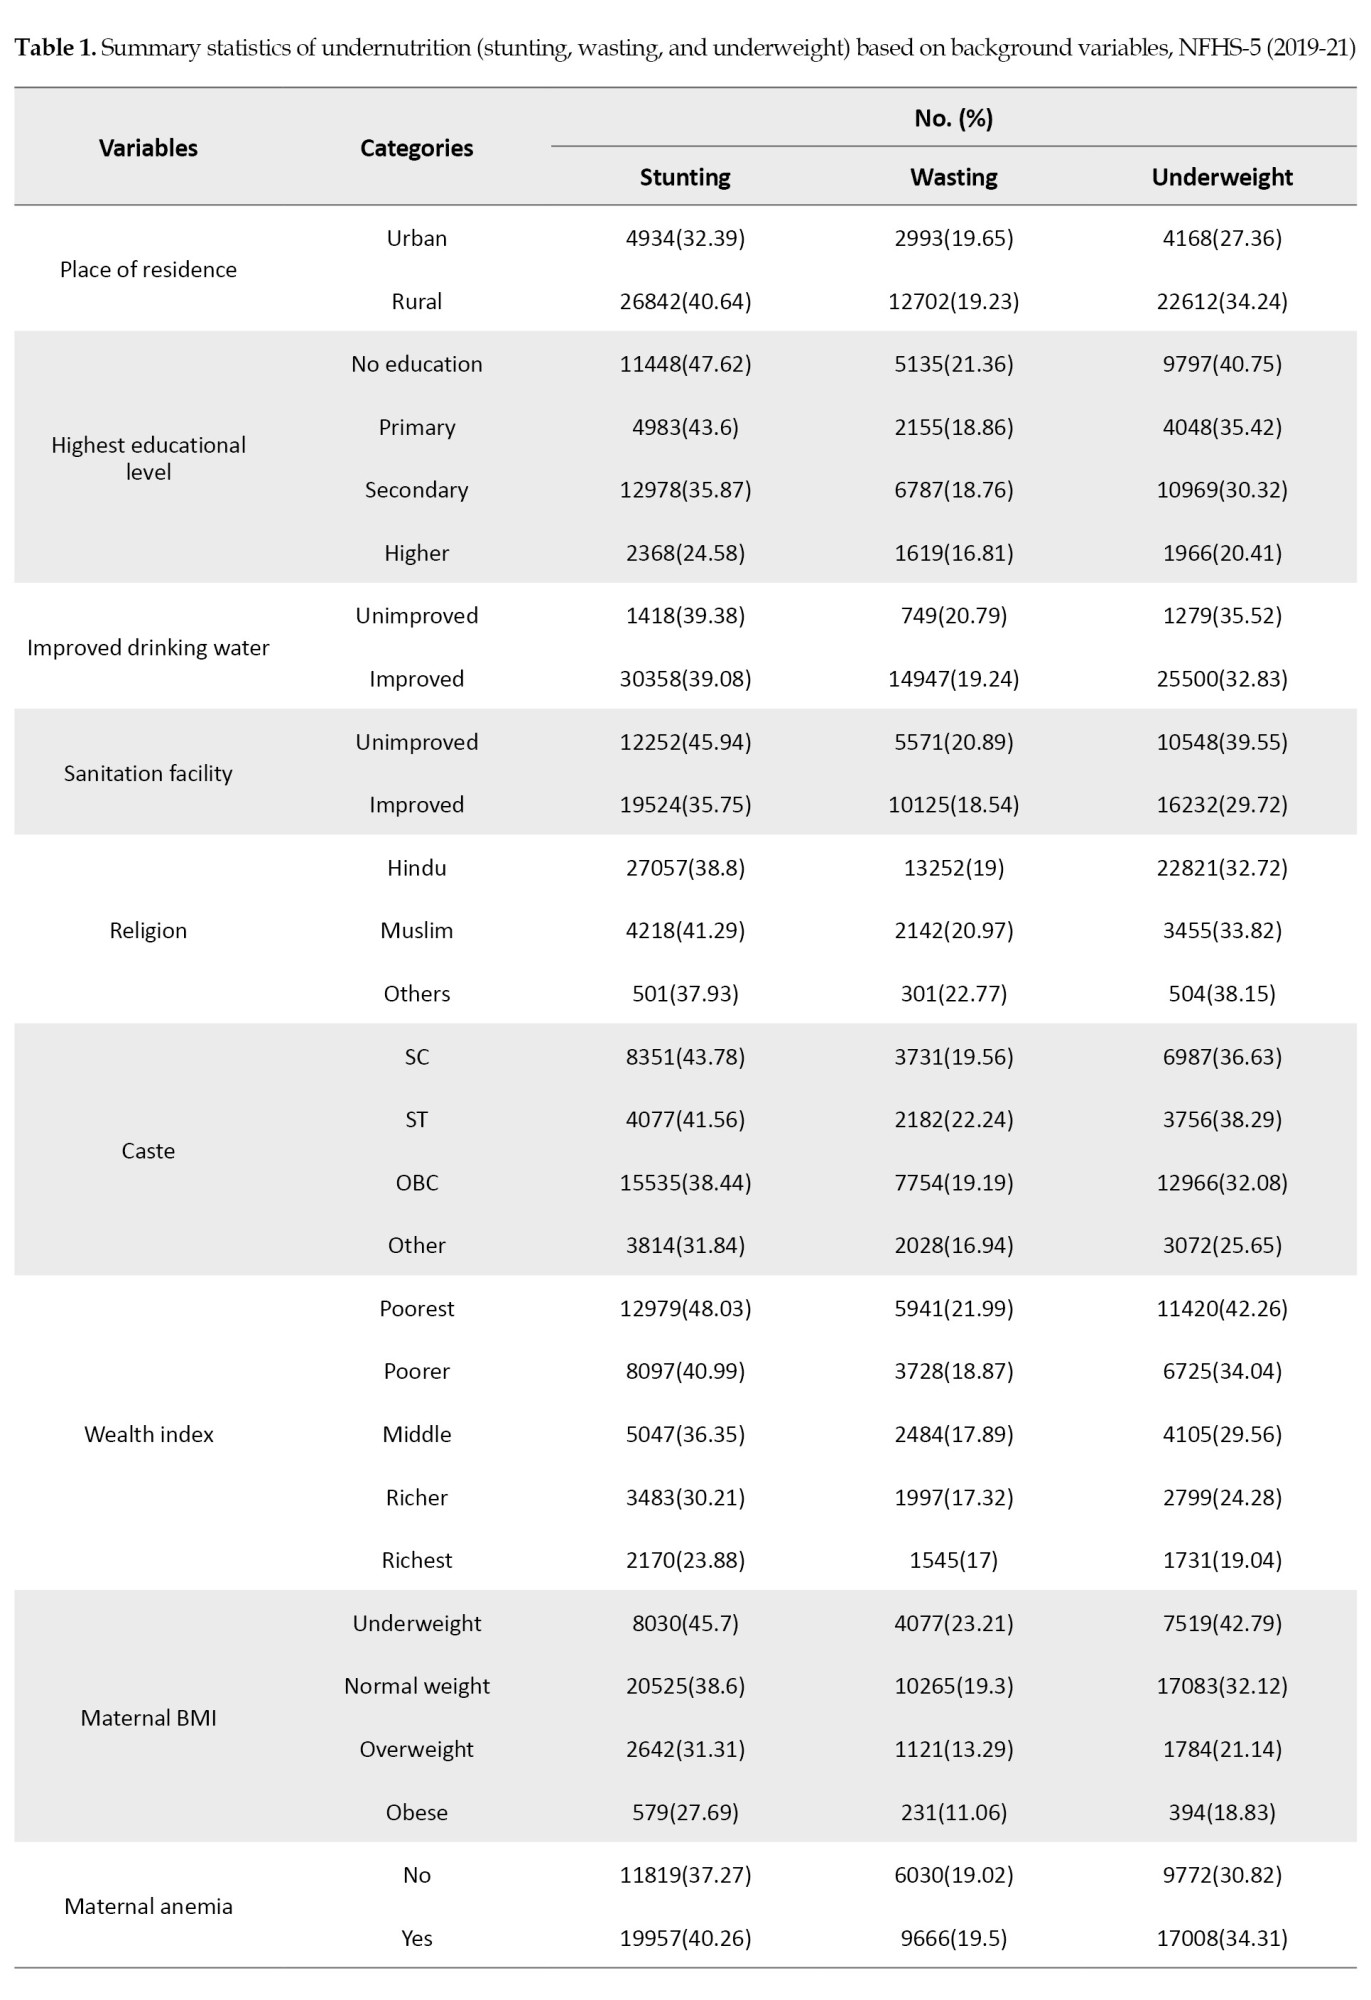
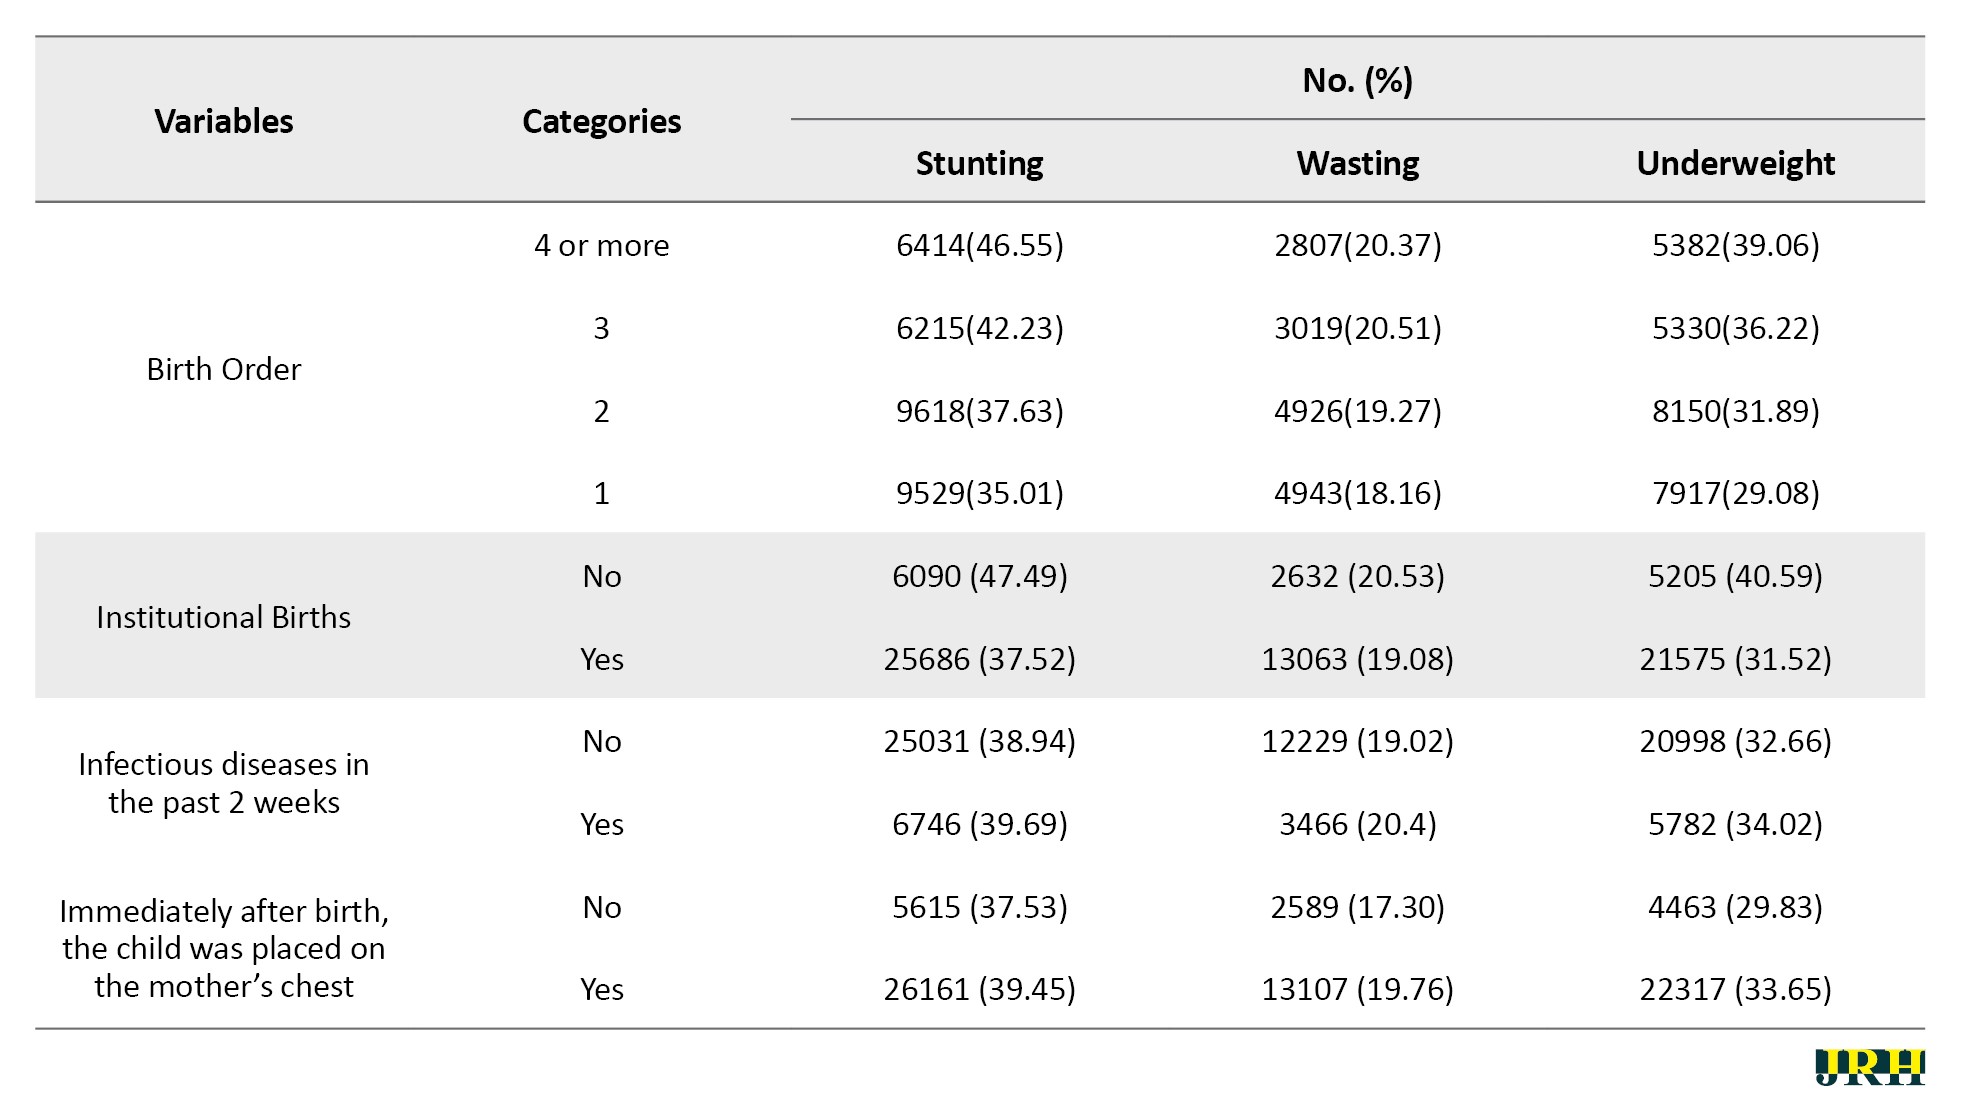
Out of a total of 81278 children under five years of age, the prevalence of stunting and underweight is nearly 10% higher in rural areas, with rates of 40.64% for stunting and 34.24% for underweight, respectively. For wasting, it is almost the same in rural and urban areas. Among children of uneducated mothers, 47.62% are stunted, 21.36% are wasted, and 40.75% are underweight. In families with unimproved drinking water, 37.83% of children are stunted, followed by 35.52% who are underweight and 16.81% who are wasted. In households having unimproved sanitation facilities, 45.94% of children were stunted, 20.89% were wasted, and 39.55% were underweight. Among children from the poorest families, the rates are 48.03% for stunting, 21.99% for wasting, and 42.26% for underweight. Similarly, among poorer children, the rates are 40.99% for stunting, 18.87% for wasting, and 34.04% for underweight [Table 1].
Figures 2A, 2B and 2C show the prevalence pattern of stunting, wasting, and underweight across districts in LSDI states of India, which range from 16.94 in Bhopal to 63.7 in Pashchimi Singhbhum for stunting, 8.54 in Sant Ravidas Nagar (Bhadohi) to 37.53 in Arwal for wasting, and 16.87 in Jhunjhunun to 60.82 in Pashchimi Singhbhum for underweight, respectively.
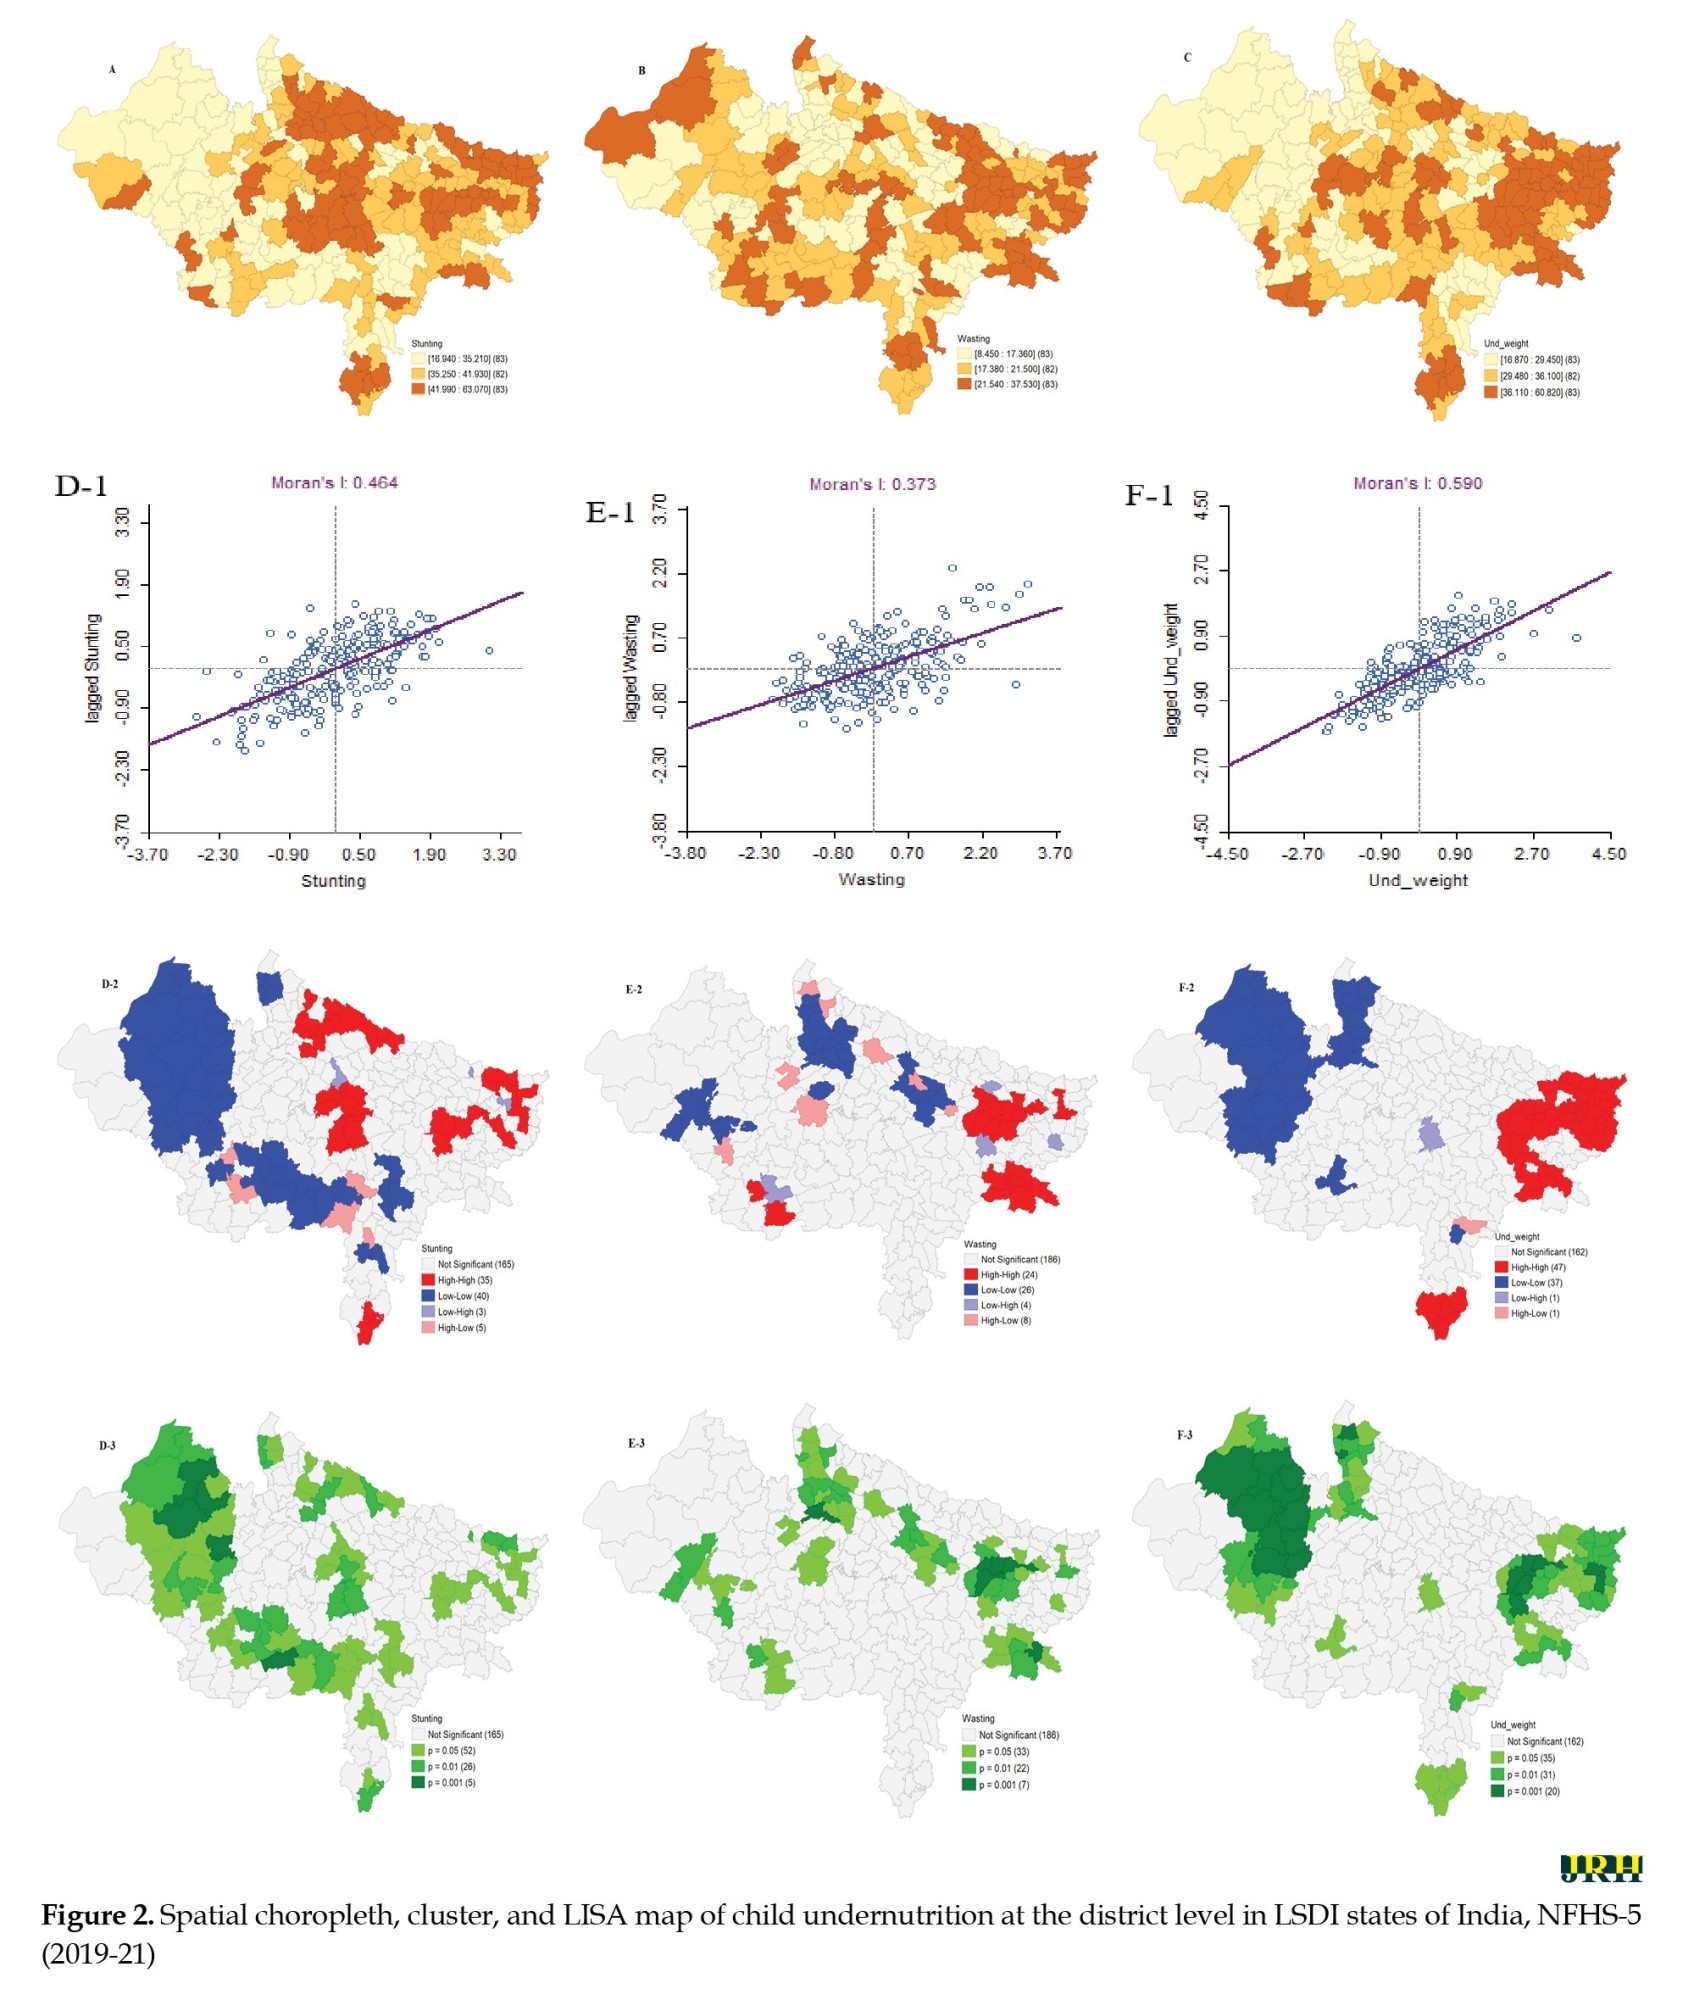 The higher prevalence of stunting and underweight was mainly concentrated in the eastern region, particularly in Uttar Pradesh, Bihar, and Jharkhand. However, the higher prevalence of wasting is scattered in clusters across various regions.
Moreover, all three outcomes of child undernutrition (stunting, wasting, and underweight) showed noticeably higher spatial autocorrelation. Spatial clustering is most pronounced for childhood underweight (Moran’s I=0.59, P<0.01). Out of the total of 424 districts, 47 hotspots and 37 cold spots were recognized (maps F-1 and F-2). In the univariate LISA cluster map of childhood stunting, 35 ‘hotspots’ and 40 ‘cold spots’ were identified (map D-1) (Moran’s I=0.464, P<0.01). The majority of the hotspots were located in parts of Uttar Pradesh (UP), Jharkhand, and Bihar (map D-2), while lower rates are observed in the states of Rajasthan, parts of Madhya Pradesh (MP), and Chhattisgarh. A statistically significant geospatial clustering with Moran’s I=0.61 (P=0.001) was also observed for childhood wasting (map E-1), where 24 ‘hotspots’ and 26 ‘cold-spots’ were identified. The hotspots were mainly located in parts of Bihar, Jharkhand, and two districts of Madhya Pradesh (MP), i.e. Khandwa and Indore, while the cold spots were located in parts of Rajasthan and Uttar Pradesh (map E-2 & E-3).
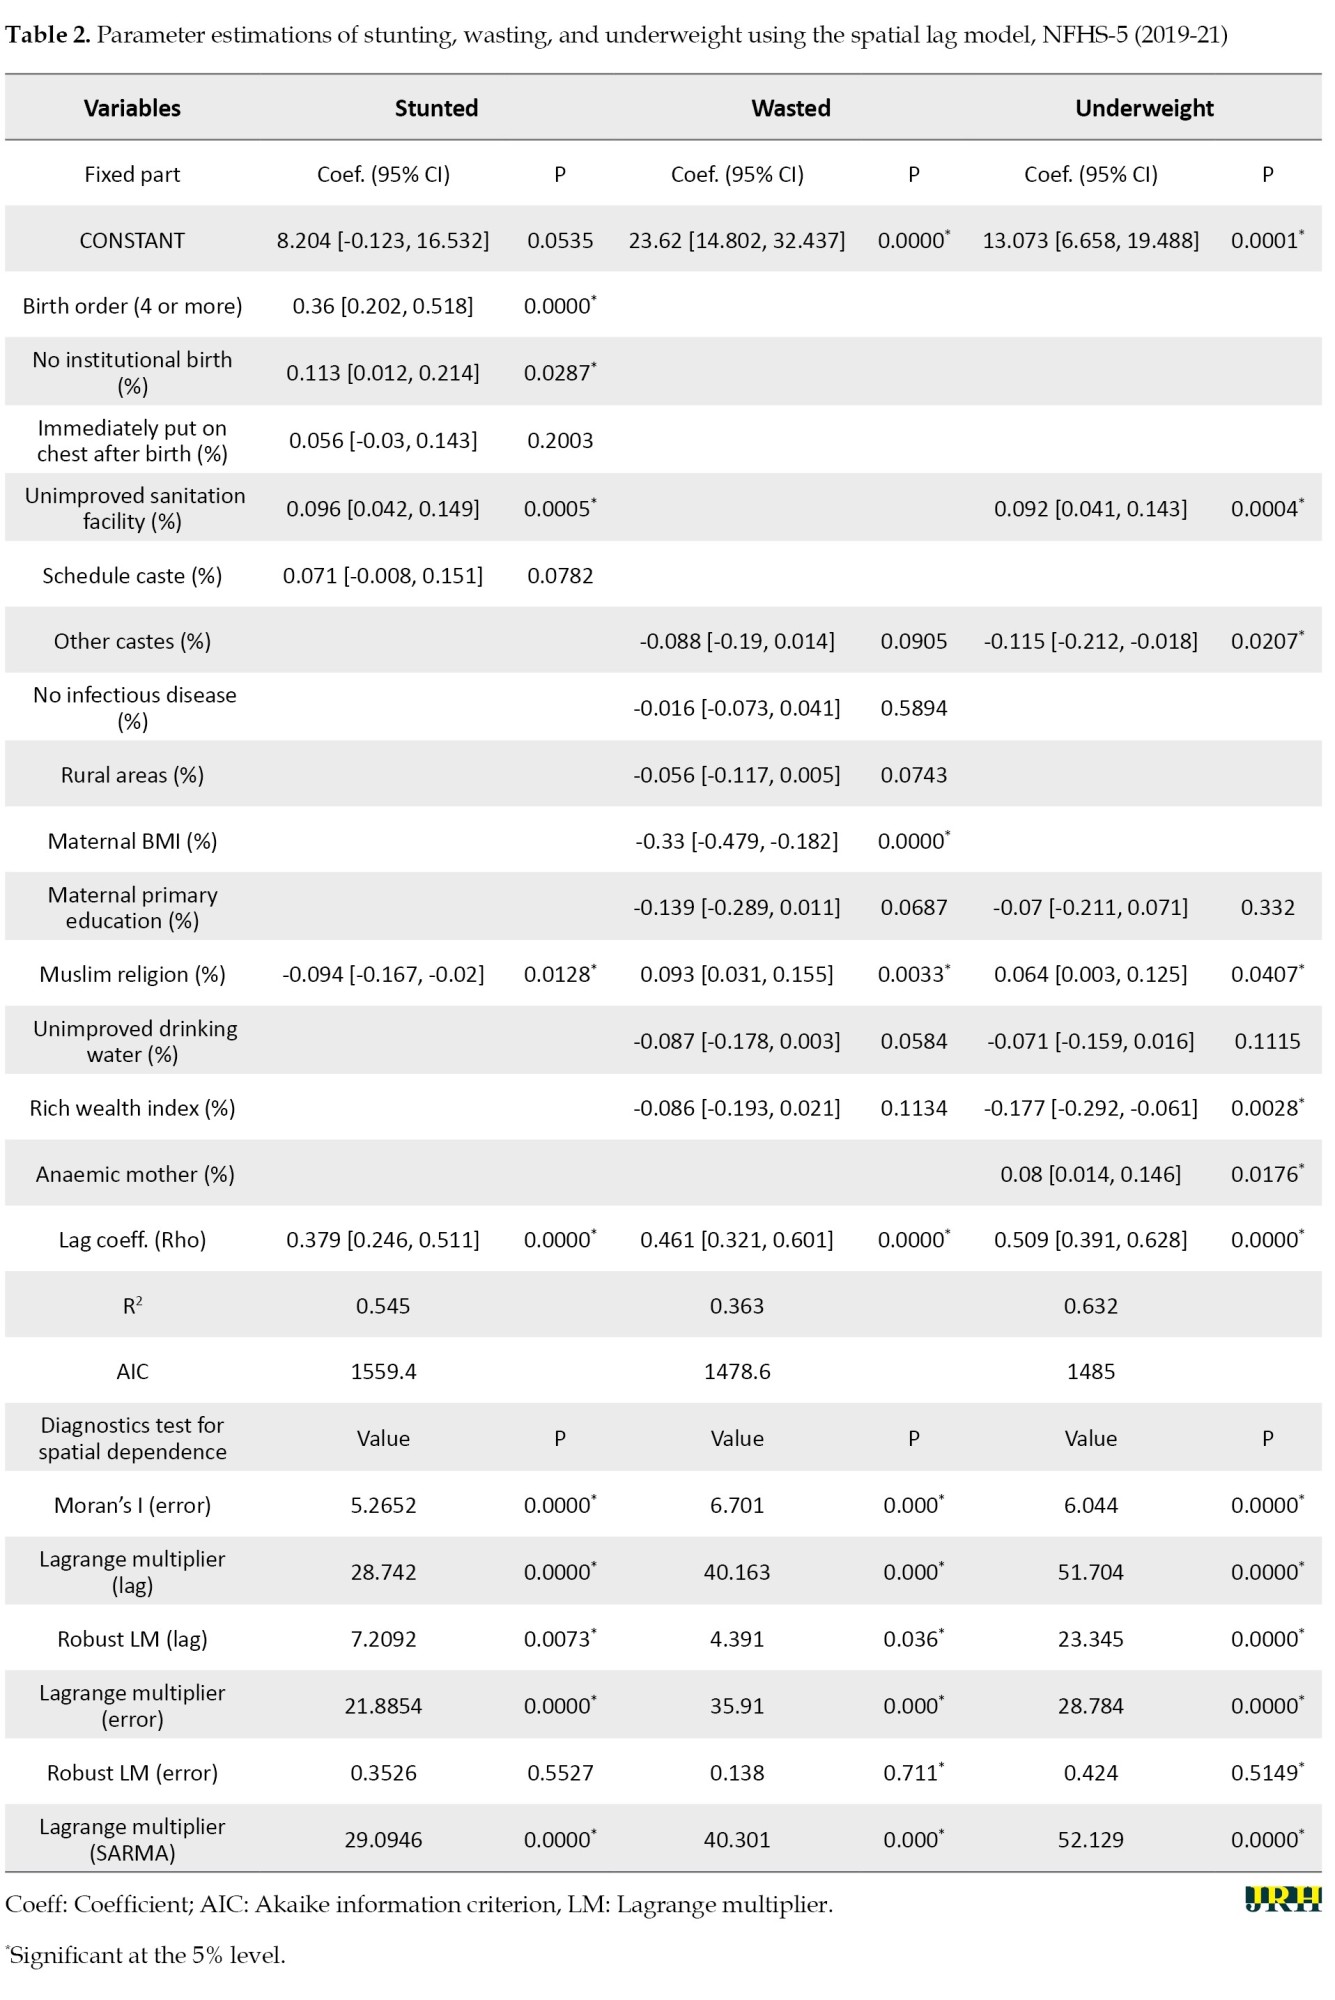
Spatial lag models (SLMs) explained 54.50%, 36.88%, and 64.62% of the variations in the rates of stunting, wasting, and underweight, respectively. The estimated coefficients for the lag model of stunting, wasting, and underweight were 0.37, 0.442, and 0.47, respectively, indicating high significance and positivity. This suggests that the prevalence of childhood undernutrition in one district directly depends on the prevalence in neighboring districts.
The estimated coefficient for childhood stunting indicates that the district proportion of households with unimproved sanitation facilities, mothers with higher birth orders, no institutional births, and the Muslim religion were associated with stunting in children under five years of age. Thus, the coefficient estimate for four or more birth orders confirms that a 10-point increase in the proportion of women with higher birth orders across the district was associated with a 3.6-point (β=0.36; 95% CI, 0.202%, 0.518%) increase in stunting prevalence. Similarly, a 10-point increase in the proportion of non-institutional births across the districts is associated with a 1.13-point (β=0.113; 95% CI, 0.012%, 0.214%) increase in stunting prevalence. While showing a negative association, the corresponding beta coefficients suggested that one unit increase in the proportion of the Muslim population across the districts was associated with a 0.094-point (β= -0.094; 95% CI, - 0.167%, -0.02%) reduction in the stunting prevalence. On the other hand, sanitation estimates suggested that a 10-point increase in the proportion of unimproved sanitation facilities across the districts was associated with a 0.96-point (β=0.096; 95% CI, 0.042%, 0.149%) increase in the stunting prevalence (Table 2).
Also, from the analysis of the wasted model, we conclude that the prevalence of wasted children under five at the district level is primarily influenced by maternal nutrition (BMI status) and the Muslim religion within the districts. The corresponding association between wasting and BMI suggests that a 10-point increase in the BMI of overweight mothers is associated with a 0.33-point (β=-0.33; 95% CI, -0.479%, -0.182%) decrease in the prevalence of wasted children across the district. Conversely, a one-point increase in the prevalence of the Muslim population is associated with a 0.093-point (β=0.093; 95% CI, 0.155%, 0.12%) increase in the proportion of wasted children. Unimproved sanitation facilities, other castes, the Muslim population, and maternal anemia showed a strong statistical association with the prevalence of childhood underweight in each district. It was found that a 10-point increase in unimproved sanitation facilities across the districts leads to a 0.92 unit (β=0.092; 95% CI, 0.041%, 0.143%) increase in childhood underweight prevalence, whereas a 10-point increase in the population of other castes results in a decrease of 1.15 points (β=-0.115; 95% CI, -0.212%, -0.018%) in childhood underweight across the districts. Similarly, a 10-point increase in the proportion of anemic mothers across the districts is associated (β=0.064; 95% CI, 0.003%, 0.125%) increase in the prevalence of underweight across districts. On the other hand, the wealth quantile suggests that a 10-point increase in the share of the rich wealth index population contributes to a reduction in the prevalence of childhood underweight by 1.77 units (β=-0.177; 95% CI, -0.014%, -0.146%) (Table 2).
Discussion
The findings from the study indicated a distinct spatial distribution of stunting, underweight, and wasting across the districts of LSDI states in India. The Moran’s I statistics indicated the level of spatial dependence, with the highest value observed for underweight, followed by stunting and wasting. This finding confirms the existence of a regional gradient of malnutrition in LSDI states of India. While a significant prevalence of malnutrition was observed in several states and regions, the concentration was most pronounced in the districts of Uttar Pradesh, Bihar, and Jharkhand. Predictors of various undernutrition statuses among children have been considered based on the k-best feature selection technique. The regression analysis (SLM) indicated a spatially significant association between malnutrition (specifically stunting, underweight, and wasting) and characteristics, such as higher birth order and lack of institutional birth, unsafe drinking water, schedule caste status, BMI of mothers, maternal education, and unimproved sanitation. No institutional delivery and higher birth order were significantly associated with a higher prevalence of stunting among children. Districts with a rich wealth index are at a lower risk of increased prevalence of wasting and being underweight.
Although the relationship between poverty and malnutrition varies by country setting, our results indicate that the rich wealth index is statistically significant only for underweight, while it does not emerge as an important feature for predicting the prevalence of undernutrition among children in the districts of LSDI states in India. However, earlier research conducted in impoverished countries demonstrated that poverty is a significant factor in the prevalence of child malnutrition [22] It will be beneficial to concentrate on these districts to decrease malnutrition and improve the overall malnutrition problem in India. Districts in LSDI states of India with a higher percentage of families not using improved sanitation facilities have a higher prevalence of stunting and underweight. Poor sanitation in households can result in pediatric illnesses, including diarrhea and other infectious diseases [23, 24]. Similar to the sanitation aspect of child nutrition, it is worth noting that the government of India initiated a cleanliness campaign called “Swachh Bharat Abhiyan” to enhance sanitation and waste management nationwide [25].
Furthermore, there was a negative association between women’s BMI and educational status with wasting. BMI is not a significant predictor for stunted and underweight individuals. Districts with a larger proportion of women with a high BMI (>25 kg/m2) were notably less likely to have a higher prevalence of wasting in children, aligning with earlier research. Maternal nutrition significantly influences the risk of poor intrauterine growth and low birth weight. Undernourished mothers may struggle to provide appropriate breastfeeding, leading to poor nutrition for their children [26-28]. Improving maternal health is essential for reducing malnutrition in children. The National Health Mission (NHM) project of the government of India aims to enhance child and maternal health throughout India [29, 30].
Conclusion
This study elucidates the spatial heterogeneity of malnutrition among children under five in districts of LSDI states in India. The findings have potential utility in improving public health strategies and identifying the root causes linked to child nutrition. It also proposes the distribution of health resources and the execution of child health interventions in the geographical hotspots with a greater prevalence of malnutrition. The occurrence of malnutrition is concentrated in specific geographic are::as char::acterized by high poverty rates, low levels of women’s education, and below-average BMI levels among women. An integrated approach involving coordination across multiple sectors is necessary to address child malnutrition in LSDI states of India. This approach should focus on reducing poverty, boosting sanitation coverage, and improving maternal nutrition.
Ethical Considerations
Compliance with ethical guidelines
The study utilized a secondary dataset from the recent NFHS-5 survey, which contains no identifiable information about the participants. Consent was obtained by NFHS-5 before and during the survey. Since this dataset is publicly available for research purposes, no additional ethical approval was required for this study.
Funding
This research did not receive any grant from funding agencies in the public, commercial, or non-profit sectors.
Authors' contributions
Conceptualization, and writing of the original draft: Mukesh Vishwakarma and Gargi Tyagi; Methodology, visualization and formal analysis: Mukesh Vishwakarma, and Pawan Kumar Dubey; Software, resources and data curation: Mukesh Vishwakarma; Validation: All authors; Supervision, review, and editing: Gargi Tyagi
Conflict of interest
The authors declared no conflict of interest.
Acknowledgments
The authors would like to thank measure DHS program for providing access to the dataset for this study.
References
Undernutrition is a health issue that occurs when there is insufficient food consumption or when the body is unable to adequately utilize the food that is consumed. This can lead to stunted growth, being underweight, or wasting of the body. It has a global impact on over 149 million children under the age of five [1]. Stunting, wasting, and underweight are standard indices used to quantify undernutrition; these indices represent distinct aspects of undernutrition. Lack of proper nutrition can have detrimental effects on one’s health, particularly for children in developing nations. This condition is known as undernutrition [2].
Malnutrition in childhood accounts for a significant portion of child deaths under the age of five, and it is particularly common in developing nations. With high prevalence rates of stunting, wasting, and underweight among children under five, malnutrition is a serious public health issue [3, 4]. The prevalence of malnutrition among under-five children is high globally, with South Asia having a particularly high prevalence [5]. Although India has experienced economic development and a decrease in poverty, the prevalence of malnutrition remains significant. The prevalence of underweight decreased from 53% to 36%, stunting decreased from 52% to 38%, whereas wasting increased from 17% to 21% [6].
Between 2005–06 and 2015–16, India made a modest decrease in the prevalence of stunting and underweight in children under five years, but the progress is insufficient compared to its economic growth. Although there was a moderate decline in child undernutrition during this period, over one-third of children under five years old remain stunted and underweight [7]. Addressing poverty, enhancing education and healthcare, increasing sanitation, and promoting understanding about child feeding may successfully reduce malnutrition in India [8].This situation of undernutrition in India is quite evident in highly populated regions, namely Uttar Pradesh, Bihar, Rajasthan, Madhya Pradesh, etc. These states also rank at the lower end of socio-demographic index (SDI) paradigm. The SDI is a composite index of development that is significantly associated with health impact. It represents the geometric mean of the indices ranging from zero to one for mean education among individuals aged 15 or older (EDU15+), total fertility rate under 25 (TFU25), and lag distributed income (LDI) per capita. A location with an SDI of zero has a theoretical minimal level of health-related development, whereas a location with an SDI of one has a theoretical maximum level [9].The SDI quantiles are utilized for classification. Based on their SDI, the states Uttar Pradesh, Bihar, Rajasthan, Madhya Pradesh, Chhattisgarh, and Jharkhand fall into the category of low socio-demographic index (LSDI)states. Recent advancements in public health research indicate that geospatial mapping and modeling of various demographic and epidemiological events, by integrating different exposure factors, are instrumental in identifying specific areas of concern. This approach enhances the accuracy of resource allocation, aiding government and policymakers in addressing community needs more effectively. Hence, this study aimed to identify spatial clustering and autocorrelation of child undernutrition at the district level, as well as to identify the spatially associated determinants of child undernutrition.
Methods
Data
Children’s recode (KR) data used in this study were obtained from the recently conducted national family health survey (NFHS- 5), 2019-21. This dataset has one record for every child of interviewed women, born in the five years preceding the survey. Unit-level data is accessible through the demographic health survey (DHS) data repository [10]. The unit of analysis in this research is the districts of LSDI states in India, which comprise 248 districts, including a total of 104692 children under the age of five years at the time of survey. A total of 81278 children was included in the final analysis sample, after removing missing values from one or more variables under consideration [11]. This study focused on three anthropometric indicators that assess the nutritional status of under-five children: Stunting (height-for-age), underweight (weight-for-age), and wasting (weight-for-height). These indicators serve as the target variables in our investigation and are widely utilized in academic literature as standardized measures of children’s nutritional well-bein [12, 13]. Underweight denotes both acute and chronic forms of malnutrition, stunting represents chronic malnourishment while wasting in children denotes acute malnutrition [14]. The independent variables included place of residence, maternal education, improved drinking water, sanitation facility, religion, caste, wealth index, maternal BMI, maternal anemia, birth order, institutional birth, infectious disease in the past two weeks, and whether the child was put on the mother’s chest immediately after birth.
Statistical analysis
Descriptive statistics, univariate local Moran’s I statistics, and a set of spatially weighted regression models were used in this study. The univariate local indicator of spatial association (LISA) maps were used to assess the association between neighborhood values surrounding a certain spatial location. This method quantifies the level of geographical randomization and clustering in the data. The values of Moran’s I can range from -1 to +1; clustering of similar values is indicated by positive values, while dissimilar values are indicated by negative values. If the value is zero, it indicates the absence of spatial autocorrelation, and the pattern is completely random [15-19]. A typical Moran’s I formula can be expressed as follows (Equation 1):
Where, x is the target variable, X̅ is the average value of x; n represents the number of spatial units, Wij represents the standardized weight matrix between observations i and j (with zeroes along the diagonal), and S0 is the total of all spatial weights, i.e. S0=∑i ∑j Wij
The univariate LISA method computes spatial autocorrelation of neighboring values at a particular spatial location. It assesses the degree of spatial randomness and clustering within the data [18]. The measure Ii is defined as follows: The univariate LISA method computes spatial autocorrelation of neighboring values at a particular spatial location. It assesses the degree of spatial randomness and clustering within the data [18]. The measure [Ii] is defined as follows (Equation 2):
To identify probable spatial correlates of undernutrition, a set of regression models was utilized to provide the best fit to the data and comprehend the relationships involved. Initially, we employed K-Best feature selection techniques to identify the most important features in the dataset, providing insights into the underlying relationships between the features and the target variable.
Next, the ordinary least squares (OLS) method has been employed with each outcome variable (stunting, wasting, and underweight) and various selected important features to estimate the presence of spatial autocorrelation in the error term and to calculate the corresponding Moran’s I statistics. Subsequently, LM Diagnostics are instituted post-OLS regression to subject the model to rigorous statistical scrutiny, specifically to identify potential misspecification [20]. A consequential examination for significance follows: If neither LM-error nor LM-lag proves significant, the analysis halts, retaining the OLS outcomes. Conversely, if there is significance in either LM-error or LM-lag, the analytical trajectory pivots toward the relevant error or lag model. In instances where both LM-error and LM-lag exhibit significance, further diagnostic scrutiny becomes imperative to inform subsequent decisions. Robust LM diagnostics are subsequently deployed, differentiating between robust LM-error and robust LM-lag. The conclusive step involves the implementation of the appropriate model—either the spatial error model or the spatial lag model—based on the discerned diagnostic outcomes (Figure 1) [21].
A trial version of Arc-GIS 10.1 (Esri, California), R Studio version 2023.12.1+402 (2009–2024 Posit Software, PBC), and Geo-Da version 1.20.0.36 (2011-2023 by Luc Anselin) was used for the analysis. All estimates in this study relied on appropriate sampling weights given by the NFHS-5, 2019-21 [10].
Results
Out of a total of 81278 children under five years of age, the prevalence of stunting and underweight is nearly 10% higher in rural areas, with rates of 40.64% for stunting and 34.24% for underweight, respectively. For wasting, it is almost the same in rural and urban areas. Among children of uneducated mothers, 47.62% are stunted, 21.36% are wasted, and 40.75% are underweight. In families with unimproved drinking water, 37.83% of children are stunted, followed by 35.52% who are underweight and 16.81% who are wasted. In households having unimproved sanitation facilities, 45.94% of children were stunted, 20.89% were wasted, and 39.55% were underweight. Among children from the poorest families, the rates are 48.03% for stunting, 21.99% for wasting, and 42.26% for underweight. Similarly, among poorer children, the rates are 40.99% for stunting, 18.87% for wasting, and 34.04% for underweight [Table 1].
Figures 2A, 2B and 2C show the prevalence pattern of stunting, wasting, and underweight across districts in LSDI states of India, which range from 16.94 in Bhopal to 63.7 in Pashchimi Singhbhum for stunting, 8.54 in Sant Ravidas Nagar (Bhadohi) to 37.53 in Arwal for wasting, and 16.87 in Jhunjhunun to 60.82 in Pashchimi Singhbhum for underweight, respectively.
Moreover, all three outcomes of child undernutrition (stunting, wasting, and underweight) showed noticeably higher spatial autocorrelation. Spatial clustering is most pronounced for childhood underweight (Moran’s I=0.59, P<0.01). Out of the total of 424 districts, 47 hotspots and 37 cold spots were recognized (maps F-1 and F-2). In the univariate LISA cluster map of childhood stunting, 35 ‘hotspots’ and 40 ‘cold spots’ were identified (map D-1) (Moran’s I=0.464, P<0.01). The majority of the hotspots were located in parts of Uttar Pradesh (UP), Jharkhand, and Bihar (map D-2), while lower rates are observed in the states of Rajasthan, parts of Madhya Pradesh (MP), and Chhattisgarh. A statistically significant geospatial clustering with Moran’s I=0.61 (P=0.001) was also observed for childhood wasting (map E-1), where 24 ‘hotspots’ and 26 ‘cold-spots’ were identified. The hotspots were mainly located in parts of Bihar, Jharkhand, and two districts of Madhya Pradesh (MP), i.e. Khandwa and Indore, while the cold spots were located in parts of Rajasthan and Uttar Pradesh (map E-2 & E-3).
Spatial lag models (SLMs) explained 54.50%, 36.88%, and 64.62% of the variations in the rates of stunting, wasting, and underweight, respectively. The estimated coefficients for the lag model of stunting, wasting, and underweight were 0.37, 0.442, and 0.47, respectively, indicating high significance and positivity. This suggests that the prevalence of childhood undernutrition in one district directly depends on the prevalence in neighboring districts.
The estimated coefficient for childhood stunting indicates that the district proportion of households with unimproved sanitation facilities, mothers with higher birth orders, no institutional births, and the Muslim religion were associated with stunting in children under five years of age. Thus, the coefficient estimate for four or more birth orders confirms that a 10-point increase in the proportion of women with higher birth orders across the district was associated with a 3.6-point (β=0.36; 95% CI, 0.202%, 0.518%) increase in stunting prevalence. Similarly, a 10-point increase in the proportion of non-institutional births across the districts is associated with a 1.13-point (β=0.113; 95% CI, 0.012%, 0.214%) increase in stunting prevalence. While showing a negative association, the corresponding beta coefficients suggested that one unit increase in the proportion of the Muslim population across the districts was associated with a 0.094-point (β= -0.094; 95% CI, - 0.167%, -0.02%) reduction in the stunting prevalence. On the other hand, sanitation estimates suggested that a 10-point increase in the proportion of unimproved sanitation facilities across the districts was associated with a 0.96-point (β=0.096; 95% CI, 0.042%, 0.149%) increase in the stunting prevalence (Table 2).
Also, from the analysis of the wasted model, we conclude that the prevalence of wasted children under five at the district level is primarily influenced by maternal nutrition (BMI status) and the Muslim religion within the districts. The corresponding association between wasting and BMI suggests that a 10-point increase in the BMI of overweight mothers is associated with a 0.33-point (β=-0.33; 95% CI, -0.479%, -0.182%) decrease in the prevalence of wasted children across the district. Conversely, a one-point increase in the prevalence of the Muslim population is associated with a 0.093-point (β=0.093; 95% CI, 0.155%, 0.12%) increase in the proportion of wasted children. Unimproved sanitation facilities, other castes, the Muslim population, and maternal anemia showed a strong statistical association with the prevalence of childhood underweight in each district. It was found that a 10-point increase in unimproved sanitation facilities across the districts leads to a 0.92 unit (β=0.092; 95% CI, 0.041%, 0.143%) increase in childhood underweight prevalence, whereas a 10-point increase in the population of other castes results in a decrease of 1.15 points (β=-0.115; 95% CI, -0.212%, -0.018%) in childhood underweight across the districts. Similarly, a 10-point increase in the proportion of anemic mothers across the districts is associated (β=0.064; 95% CI, 0.003%, 0.125%) increase in the prevalence of underweight across districts. On the other hand, the wealth quantile suggests that a 10-point increase in the share of the rich wealth index population contributes to a reduction in the prevalence of childhood underweight by 1.77 units (β=-0.177; 95% CI, -0.014%, -0.146%) (Table 2).
Discussion
The findings from the study indicated a distinct spatial distribution of stunting, underweight, and wasting across the districts of LSDI states in India. The Moran’s I statistics indicated the level of spatial dependence, with the highest value observed for underweight, followed by stunting and wasting. This finding confirms the existence of a regional gradient of malnutrition in LSDI states of India. While a significant prevalence of malnutrition was observed in several states and regions, the concentration was most pronounced in the districts of Uttar Pradesh, Bihar, and Jharkhand. Predictors of various undernutrition statuses among children have been considered based on the k-best feature selection technique. The regression analysis (SLM) indicated a spatially significant association between malnutrition (specifically stunting, underweight, and wasting) and characteristics, such as higher birth order and lack of institutional birth, unsafe drinking water, schedule caste status, BMI of mothers, maternal education, and unimproved sanitation. No institutional delivery and higher birth order were significantly associated with a higher prevalence of stunting among children. Districts with a rich wealth index are at a lower risk of increased prevalence of wasting and being underweight.
Although the relationship between poverty and malnutrition varies by country setting, our results indicate that the rich wealth index is statistically significant only for underweight, while it does not emerge as an important feature for predicting the prevalence of undernutrition among children in the districts of LSDI states in India. However, earlier research conducted in impoverished countries demonstrated that poverty is a significant factor in the prevalence of child malnutrition [22] It will be beneficial to concentrate on these districts to decrease malnutrition and improve the overall malnutrition problem in India. Districts in LSDI states of India with a higher percentage of families not using improved sanitation facilities have a higher prevalence of stunting and underweight. Poor sanitation in households can result in pediatric illnesses, including diarrhea and other infectious diseases [23, 24]. Similar to the sanitation aspect of child nutrition, it is worth noting that the government of India initiated a cleanliness campaign called “Swachh Bharat Abhiyan” to enhance sanitation and waste management nationwide [25].
Furthermore, there was a negative association between women’s BMI and educational status with wasting. BMI is not a significant predictor for stunted and underweight individuals. Districts with a larger proportion of women with a high BMI (>25 kg/m2) were notably less likely to have a higher prevalence of wasting in children, aligning with earlier research. Maternal nutrition significantly influences the risk of poor intrauterine growth and low birth weight. Undernourished mothers may struggle to provide appropriate breastfeeding, leading to poor nutrition for their children [26-28]. Improving maternal health is essential for reducing malnutrition in children. The National Health Mission (NHM) project of the government of India aims to enhance child and maternal health throughout India [29, 30].
Conclusion
This study elucidates the spatial heterogeneity of malnutrition among children under five in districts of LSDI states in India. The findings have potential utility in improving public health strategies and identifying the root causes linked to child nutrition. It also proposes the distribution of health resources and the execution of child health interventions in the geographical hotspots with a greater prevalence of malnutrition. The occurrence of malnutrition is concentrated in specific geographic are::as char::acterized by high poverty rates, low levels of women’s education, and below-average BMI levels among women. An integrated approach involving coordination across multiple sectors is necessary to address child malnutrition in LSDI states of India. This approach should focus on reducing poverty, boosting sanitation coverage, and improving maternal nutrition.
Ethical Considerations
Compliance with ethical guidelines
The study utilized a secondary dataset from the recent NFHS-5 survey, which contains no identifiable information about the participants. Consent was obtained by NFHS-5 before and during the survey. Since this dataset is publicly available for research purposes, no additional ethical approval was required for this study.
Funding
This research did not receive any grant from funding agencies in the public, commercial, or non-profit sectors.
Authors' contributions
Conceptualization, and writing of the original draft: Mukesh Vishwakarma and Gargi Tyagi; Methodology, visualization and formal analysis: Mukesh Vishwakarma, and Pawan Kumar Dubey; Software, resources and data curation: Mukesh Vishwakarma; Validation: All authors; Supervision, review, and editing: Gargi Tyagi
Conflict of interest
The authors declared no conflict of interest.
Acknowledgments
The authors would like to thank measure DHS program for providing access to the dataset for this study.
References
- Maniragaba VN, Atuhaire LK, Rutayisire PC. Undernutrition among the children below five years of age in Uganda: A spatial analysis approach. BMC Public Health. 2023; 23(1):390. [DOI:10.1186/s12889-023-15214-9] [PMID] [PMCID]
- Nandy S, Irving M, Gordon D, Subramanian SV, Smith GD. Poverty, child undernutrition and morbidity: New evidence from India. Bulletin of the World Health Organization. 2005; 83(3):210-6. [PMID]
- Amusa LB, Yahya WB, Bengesai AV. Spatial variations and determinants of malnutrition among under-five children in Nigeria: A population-based cross-sectional study. Plos One. 2023; 18(4):e0284270. [DOI:10.1371/journal.pone.0284270] [PMID] [PMCID]
- Fenta HM, Zewotir T, Muluneh EK. Spatial data analysis of malnutrition among children under-five years in Ethiopia. BMc Medical Research Methodology. 2021; 21(1):232. [DOI:10.1186/s12874-021-01391-x] [PMID] [PMCID]
- Dmello MK, Badiger S, Kumar S, Galey K, Kumar N, Dsouza N. Geospatial analysis of malnutrition among under-five children: A scoping review. Journal of Health and Allied Sciences NU. 2023; 13(04):459-68. [DOI:10.1055/s-0043-1762579]
- Khan, J., & Mohanty, S. K. (2018). Spatial heterogeneity and correlates of child malnutrition in districts of India. BMC public health, 18(1), 1-13. [DOI:10.1186/s12889-018-5873-z] [PMID] [PMCID]
- Jose S, Bheemeshwar RA, Agrawal M. Child undernutrition in India. Economic and Political Weekly. 2018; 53(48):63. [Link]
- Khan J, Mohanty SK. Spatial heterogeneity and correlates of child malnutrition in districts of India. BMC Public Health. 2018; 18(1):1027. [DOI:10.1186/s12889-018-5873-z] [PMID] [PMCID]
- Global Burden of Disease (GBD). Global burden of disease study 2019 (GBD 2019) socio-demographic index (SDI) 1950-2019. Seattle: Institute for Health Metrics and Evaluation (IHME); 2020. [Link]
- The DHS Program - data [Internet]. 2024. [Updated 2024 August 20. Available from [Link]
- Survey of India. [Internet]. 2024. [Updated 2024 August 20. Available from [Link]
- World Health Organization (WHO). WHO child growth standards: Length/height for age,weight-for-age, weight-for-length, weight-for-height and body mass indexfor- age, methods and development. Geneva: World Health Organization; 2006. [Link]
- World Health Organization (WHO). Child growth standards. Geneva: World Health Organization; 2011. [Link]
- Mejía-Guevara I, Krishna A, Corsi DJ, Subramanian SV. Individual and ecological variation in child undernutrition in India: a multilevel analysis. Journal of South Asian Development. 2015; 10(2):168-98. [DOI:10.1177/0973174115588841]
- Anselin L. Spatial econometrics: Methods and models. Berlin: Springer Science and Business Media; 1988. [DOI:10.1007/978-94-015-7799-1]
- Anselin L. Local indicators of spatial association—LISA. Geographical Analysis. 1995; 27(2):93-115. [DOI:10.1111/j.1538-4632.1995.tb00338.x]
- Anselin L, Syabri I, Kho Y. GeoDa: An introduction to spatial data analysis. In: Fischer MM, Getis A, editors. Handbook of applied spatial analysis: Software tools, methods and applications. Berlin: Springer; 2010. [DOI:10.1007/978-3-642-03647-7_5]
- Duncan T. Commission on macroeconomics and health. Health, nutrition and economic prosperity: A microeconomic perspective. CMH working papers no WG1: 7. Geneva: World Health Organization; 2001. [Link]
- Srivastava S, Chaurasia H, Singh KJ, Chaudhary P. Exploring the spatial patterns of cesarean section delivery in India: Evidence from national family health survey-4. Clinical Epidemiology and Global Health. 2020; 8(2):414-22. [DOI:10.1016/j.cegh.2019.09.012]
- Catani P, Teräsvirta T, Yin MA. Lagrange multiplier test for testing the adequacy of constant conditional correlation GARCH model. Econometric Reviews. 2017; 36(6-9):599-621. [DOI:10.1080/07474938.2017.1307311]
- Anselin L. Exploring spatial data with GeoDaTM: A workbook. Santa Barbara: Center for Spatially Integrated Social Science; 2005. [Link]
- Thomas D, Frankenberg E. Health, nutrition and prosperity: A microeconomic perspective. Bull World Health Organ. 2002; 80(2):106-13. [PMID]
- Rah JH, Cronin AA, Badgaiyan B, Aguayo VM, Coates S, Ahmed S. Household sanitation and personal hygiene practices are associated with child stunting in rural India: A cross-sectional analysis of surveys. BMJ Open. 2015; 5(2):e005180. [DOI:10.1136/bmjopen-2014-005180] [PMID] [PMCID]
- Spears D, Ghosh A, Cumming O. Open defecation and childhood stunting in India: An ecological analysis of new data from 112 districts. Plos One. 2013; 8(9):e73784. [DOI:10.1371/journal.pone.0073784] [PMID] [PMCID]
- Dasgupta S, Ramaswamy D, Noronha KM, Rao S, George N, Singh A, et al. Swachh bharat: Industry engagement-scope & examples. New Delhi: Centre for Policy Research; 2016. [DOI:10.2139/ssrn.2720214]
- Black RE, Victora CG, Walker SP, Bhutta ZA, Christian P, de Onis M, et al. Maternal and child undernutrition and overweight in low-income and middle-income countries. Lancet. 2013; 382(9890):427-451 [DOI:10.1016/S0140-6736(13)60937-X] [PMID]
- Rahman M, Roy SK, Ali M, Mitra AK, Alam AN, Akbar MS. Maternal nutritional status as a determinant of child health. Journal of Tropical Pediatrics. 1993; 39(2):86-8. [DOI:10.1093/tropej/39.2.86] [PMID]
- Rahman A, Chowdhury S. Determinants of chronic malnutrition among preschool children in Bangladesh. Journal of Biosocial Science. 2007; 39(2):161-73. [DOI:10.1017/S0021932006001295] [PMID]
- Falcao VL, Khanuja J, Matharu S, Nehra S, Sinha D. Report on the study of the indira gandhi matritva sahyog yojana. New Delhi: Centre for Equity Studies; 2015. [Link]
- Murray SF, Hunter BM, Bisht R, Ensor T, Bick D. Effects of demand-side financing on utilisation, experiences and outcomes of maternity care in low- and middle-income countries: A systematic review. BMC Pregnancy Childbirth. 2014; 14:30. [DOI:10.1186/1471-2393-14-30] [PMID] [PMCID]
Type of Study: Orginal Article |
Subject:
● Disease Control
Received: 2024/08/25 | Accepted: 2024/12/16 | Published: 2025/05/30
Received: 2024/08/25 | Accepted: 2024/12/16 | Published: 2025/05/30
| Rights and permissions | |
 |
This work is licensed under a Creative Commons Attribution-NonCommercial 4.0 International License. |

This is an open access article distributed under the terms of the Creative Commons Attribution License (CC-By-NC), which permits use, distribution, and reproduction in any medium, provided the original work is properly cited and is not used for commercial purposes.
Contact Information