

Volume 16, Issue 1 (Jan & Feb 2026)
J Research Health 2026, 16(1): 83-94 |
Back to browse issues page


Ethics code: IR.GOUMS.REC.1399.270
Download citation:
BibTeX | RIS | EndNote | Medlars | ProCite | Reference Manager | RefWorks
Send citation to:


BibTeX | RIS | EndNote | Medlars | ProCite | Reference Manager | RefWorks
Send citation to:
Heidari A, Khodabandelu S, Khatirnamani Z, Rafiei N, Gholami M. Modeling Mortality Rates Based on the Lee-Carter Model in Golestan Province, Iran: 2011-2028. J Research Health 2026; 16 (1) :83-94
URL: http://jrh.gmu.ac.ir/article-1-2639-en.html
URL: http://jrh.gmu.ac.ir/article-1-2639-en.html


1- Health Management and Social Development Research Center, Golestan University of Medical Sciences, Gorgan, Iran
2- Department of Biostatistics and Epidemiology, Student Research Committee, School of Health, Mazandaran University of Medical Sciences, Sari, Iran
3- Health Management and Social Development Research Center, Golestan University of Medical Sciences, Gorgan, Iran ,khatirzahra@gmail.com
2- Department of Biostatistics and Epidemiology, Student Research Committee, School of Health, Mazandaran University of Medical Sciences, Sari, Iran
3- Health Management and Social Development Research Center, Golestan University of Medical Sciences, Gorgan, Iran ,
Full-Text [PDF 1468 kb]
(126 Downloads)
| Abstract (HTML) (2373 Views)
Full-Text: (37 Views)
Introduction
Reliable information on the causes of death, mortality trends, and their changes is one of the most basic principles of planning, management, and evaluation of health sectors in all countries [1, 2]. Modeling and predicting crude death rates at any particular age has long been considered by demographers as a general indicator of mortality rates. Therefore, any attempt to increase the accuracy of predicting future mortality patterns will have a direct impact on improving the results of each of the above applications [3].
Most new methods for predicting mortality use two-factor models with age and period as two factors. The Lee-Carter (LC) model is one of these two-factor models for predicting mortality [4, 5]. The emergence of the LC method dates back to a change in life expectancy patterns in the United States (US) in 1900. This led to Lee and Carter’s research on modeling and predicting the long-term mortality rate of the entire US population, called population time modeling and forecasting. Although this method was based on US mortality data from 1900 to 1987, it performed very well in modeling and predicting long-term mortality rates in many developed countries, including Chile (1994), Japan (1996), England (2003), Sweden (2004) and Italy (2005) [3]. In summary, this method predicts mortality by age and length of period for a single population as a general time trend, an age component, and the rate of change over time in terms of age [5]. Overall, one of the strengths of the LC and other generalization methods is their use in situations where mortality rates show a linear trend across age groups [6].
The LC method, as a generalization method, is a combination of an affluent demographic model (with the fewest parameters) and time-series methods. Although in this method, as in other generalization methods, information about the effects of medical advances, behavioral or social, is not included in the mortality rate, it is superior to other extrapolation methods for several reasons. First, a large part of the changes in the total mortality rate in developed countries is covered by this model, Second, the model parameters are easy to interpret. Third, this method, in addition to predicting mortality rates over time, can also provide the corresponding confidence intervals. In demographic texts, this method has been described as a prominent statistical model for long-term prediction of the population’s total mortality rate [7].
The results of the study using the LC model showed that the mortality trend from accidents and respiratory diseases in Golestan Province, Iran, is increasing; therefore, it is necessary to plan to reduce accidents and incidents, and in this regard, specific strategies should be developed and implemented by explaining the role of all stakeholders [8].
The mortality rate in age groups in Golestan Province shows a linear trend, and considering that the LC method has been introduced as a leading model for predicting mortality [9, 10]. Therefore, this study aimed to model and predict mortality rates using the LC model.
Methods
This study was a secondary analysis based on available data. The study population included all deaths registered in the health department of Golestan University of Medical Sciences during 2011-2018. Information about mortality (cause of death, age, and sex) was obtained from the golestan death registry as an Excel file.
The disease classification system is based on ICD-10. Causes of death are determined and coded by the International Statistical Classification of Diseases and Related Health Problems. To correct codes for impossible causes of death by age and sex, and for possible causes of death in terms of fatality, the global disease load study framework for 2010 and 2013 was used [11-13].
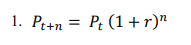
For demographic estimates in this paper, the mathematical method according to Equation 1 was used. Where Pt + n population in the second census, Pt population in the first census, n distance between the two censuses, and r is the annual population growth rate that is the basis of the calculations.
The crude death rate at age x and time t in a society is shown with Mx,t and is calculated using the following relationship (Equation 2):
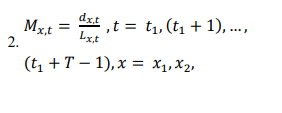
Where dx,t , and , Lx,t represent the number of deaths and the population exposed to the event of death at age x and time t for that community, and t1 for the first time, and N is the number of ages or age groups under study.
In practice, the mortality rate is obtained by dividing the number of deaths of each age by the middle population of that age. The middle population at any age estimates the population at risk of death based on population and housing censuses.
The structure of the proposed model of LC is as Equation 3:
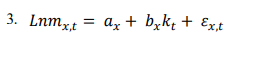
Where Lnmx,t indicates the natural logarithm of death rates observed at age x and in year t, and, ax, bx and kt are age- and time-dependent parameters, respectively. ax, indicates the average time logarithm of death rates at age x, in other words, εx,t illustrates the overall shape of the mortality rate’s curve; kt is the mortality index in year t which indicates the primary trend in the natural logarithm of mortality rates for all ages over time; and bx shows the rate of changes in the mortality rate logarithm at age x to (per) changes in the mortality index over time. Component, εx,t is equal to the component error at age x and time t. According to Equation 3, the following relationship is obtained (Equation 4):
According to Equation 3, if the kt mortality index decreases linearly over time, the age-specific mortality rate will decrease at a constant exponential rate. The error terms, εx,t, have a Gaussian distribution with zero mean and variance σ2ε and represent part of the changes in age-specific mortality rate that cannot be explained by the model. Lee and Carter believe that the parameter covers the major scatter in the data and, as a result, the error term’s variance is constant over time [14].
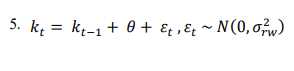
After estimating the model parameters and age-specific mortality rates, the LC model is employed to predict mortality rates. For this purpose, Lee and Carter first developed a time-series model for kt and then predicted the number of kt, they predicted the mortality rate mx,t for each age group, and at any particular time. For the prediction, first kt is predicted applying time-series modeling, and its future values are then used to predict k_ [t+1]. Finding the best model for kt is crucial because an inappropriate model will result in incorrect predictions of the future behavior of the mortality rate. The random walk model with drift for kt is presented as Equation 5:
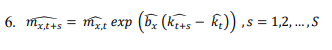
In the second stage of prediction, values for age-specific mortality rates are anticipated. Regardless of the error term, changes in the rate of deaths in a particular year are completely dependent on each other and are linear functions of the time variable parameter of kt. Therefore, to calculate confidence intervals of mortality rates in any age group and in any given year, only kt confidence interval should be calculated. The prediction of mortality rates for the estimated parameter values βx and αx and predicted values kt is calculated according to the Equation 6 [14]:
All steps of the model analysis and fitting were performed using Demography software, version 18.1 and StMoMo packages in R software, version 3/6/2.
Results
During 2011-2018, 60 082 deaths occurred in Golestan Province due to various reasons. The Mean±SD of the deceased was 58.92±26.64 years (57.25±26.62 years in men and 61.30±26.32 years in women). A total of 43.2% were women and 56.8% were men.
Empirical analysis for data
In this section, the possibility of using the LC method to predict population mortality has been investigated. The classic LC model and its extensions were proportional to the mortality rate matrix of Golestan Province from 2011 to 2018. This model was fitted using a Poisson error structure. Duplicate algorithms were used to estimate the parameters. Also, using the autoregressive integrated moving average (ARIMA) framework, A multivariate random walk with drift, a variable index with mortality time was predicted. In the final stage, the death rate in Golestan Province was predicted for the next ten years.
Data source
The annual number of deaths by age is available in 17 age groups (ranging from less than one year to over 80 years old, with an interval of 4 years) for the population of Golestan Province from 2011 to 2018. The total number of exposures to the risk of the death is necessary to calculate empirical mortality rate. Therefore, x (x1, x17) and t (t1, t8), so that xi; i=1, …, 17, i-th age group and tj; j=1, …, 8, j shows the seventh year from 2011 to 2018.
An investigation of the death rate trend from 2011 to 2018 shows that, across all age groups, this trend has been constant; therefore, one of the main assumptions of the LC model was established.
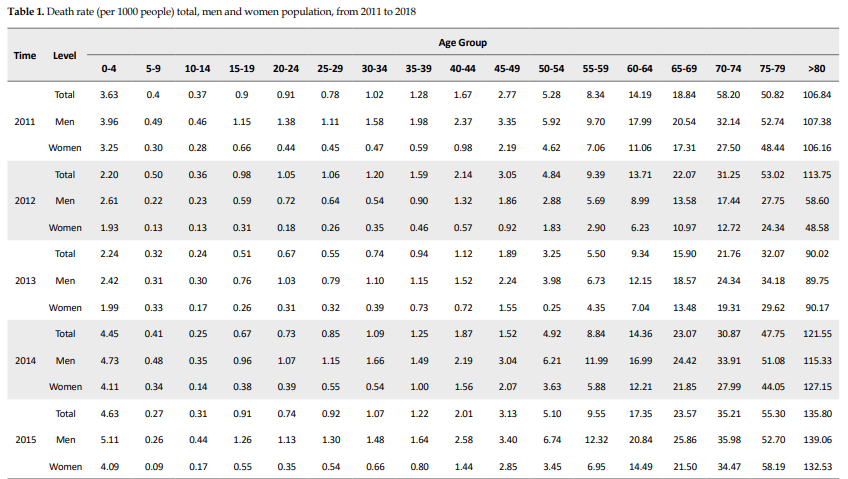
By dividing the number of deaths by the total number of people at risk of death, the experimental mortality rate was obtained and used to fit the LC model. Table 1 presents the death rate per capita for men and women from 2011 to 2018. The mortality rate is high in the first age group, which includes infants, but decreases for the next age group and then increases for the older age groups. In addition, the latest age groups, which include the elderly (age group>65 years), have the highest death rates. Therefore, these tables present the same trends in the real world.
.PNG)
Estimation of LC model parameters
The estimation of model parameters is the first step after data collection. These estimates can then be used to predict future mortality. Table 2 presents the estimated parameter values αx and βx for the whole population and for men and women. Figure 1 also plots past values with time-series model predictions and associated confidence intervals for men, women, and the total population.
.PNG)
.PNG)
In all age groups, αx values are higher for men than for women, indicating that the overall death rate for men is higher than for women. Under the LC method, αx is the average of the log values of the mortality rate and is estimated by averaging over all years. The first and last age groups, including infants and older people, have the highest αx values. This means that, as expected, these age groups have more excellent age effects on mortality. The coefficients of women of all ages are below that of others, reflecting the fact that mortality for women is lower on average. According to previous studies, after the age of 4 years, the mortality rate gradually decreases, and after the age of 80 years, it increases [15].
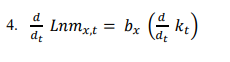
The bx coefficients describe the relative sensitivity of death rates to variation in the kt parameter. It is not surprising that sets of coefficients for all three cases look pretty similar for each age group. Because of the normalization, their absolute levels have no particular meaning. With N age groups, if βx=βy=1/N for all x, y, then all the rates would move up and down proportionately, maintaining constant ratios to one another. However, it can be observed that some ages are much more sensitive than others. The smaller the age, the greater its sensitivity to variations in the t k parameter. The exponential rate of change of an age group’s mortality is proportional to the bx values (Equation 7):
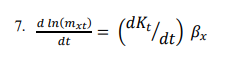
If kt decreases linearly with time, then will be constant and each mxt will decrease with its constant exponential velocity.
Table 2 also presents the estimated βx values, which are higher for 0 to 4-year age group than for the other groups, indicating that the mortality rate in this age group is very different and that this group plays a significant role in kt change. Also, the following influential age group is the last one, which includes older people. When βx is significant for some x, the mortality rate at age x changes significantly. When the general mortality rate changes (e.g. x=0 for infant mortality) and when βx is small, the rate of change at that age changes slightly. This often happens in the case of mortality at older ages.
kt decreases directly from 2011 to 2012; however, for reasons unclear to us, it increases from 2013 to 2015 and 2016 to 2018 only to have a downward trend again. If we compare male and female mortality, we can see that male mortality is higher than female mortality; therefore, work on possible improvements in reducing male mortality can be more evident than in females.
Residuals
Figure 1 shows the residuals of the LC model for the male, female, and total population in Golestan Province. In these figures, lighter colors indicate smaller residuals and darker colors indicate larger residuals. As shown in the plot of independent residuals, residuals with similar, relatively large values are grouped together, indicating the spatial structure of the residuals. Considering this spatial correlation structure for model residues and estimating it is vital in analyzing mortality data.
In the second stage of prediction, age-specific mortality rate values are predicted. If the error terms are omitted, the changes in mortality rates in a given year are wholly interdependent and a function of the time-varying parameter kt. Therefore, to calculate the confidence interval for the mortality rate in each age group and each specific year, it is sufficient to calculate the confidence interval.
Forecast
At this point, we can proceed directly to the next step: modeling kt as a time-series process that depends on time. We can fit the time series model with kt to predict them over the desired time period. In other words, we treat this time-dependent parameter as a time series and use the Box and Jenkins method [16] to find suitable time series models for it, after which we can predict it. To use the Box and Jenkins method for time-series forecasting, the time series must be stationary, that is, it must have a constant mean, variance, and correlation over time.
Now, we can use the ARIMA model selected in R software to generate a forecast of the kt parameter for the next ten years, based on data from 2011 to 2018.
Once we have predicted the mortality index, we can generate values related to the mortality rate. Also, the expected mortality rates, classified by age, are presented in Table 3 separately for the total population, men, and women for the years 2019-2028. According to the results, the mortality trend in all age and sex groups during 2019-2028 is expected to be downward. As predicted in 2028, the mortality rate in the age group over 80 years reached from 107.14 to 72.43 in the total population, from 90.12 to 42.11 in men, and from 101.49 to 52.25 in women (per 1000 population). It is also predicted that the mortality rate in the age group of less than five years will decrease from 2.24 to 0.62 in the total population, from 2.35 to 0.84 in men, and from 2.07 to 0.94 in women (per 1000 population).
.PNG)
.PNG)
Discussion
The present study is an applied study to model and predict mortality. First, census and death data have been evaluated. After modeling changes in mortality between 2011 and 2018 and recognizing the mortality pattern, mortality rates for Golestan Province up to 2028 have been predicted. The findings of this paper show that the power and efficiency of the LC model in predicting mortality in Golestan Province is high. The LC model is an alternative method that can directly predict mortality by age, and the predicted figures can be easily converted into any mortality indicator, including life expectancy, by constructing a real-life table. This method is superior to other methods of directly predicting mortality or life expectancy for several reasons. First, if each rate is best modeled by an ARIMA model, it needs to estimate many parameters. Second, by independently predicting each rate, it is necessary to calculate the number of N (N-1)/2 covariances of the error expressions (N is the number of age groups). Whereas in the LC method, since the mortality rate in different age groups in each year is a function of the parameter, a strong correlation is observed between this rate and the index, and the variance and covariance of the error expressions are determined by the selected model for kt. Third, independent forecasting of each rate makes it possible to combine rates and form unlikely age structures in the future. In contrast, in the LC model, since the trend in all age-specific mortality rates is modeled by the parameter, all estimated rates will belong to a life table [3]. Despite all the advantages that can be listed for the LC model, and although the evaluation of the results obtained in many applications of this model shows the high efficiency of the model, it should not be forgotten that the assumptions related to the fixed age pattern in this model are not met in some cases.
It is expected that the mortality rate in all age and sex groups during the years 2019 -2028 have a downward trend in Golestan province. Jahangiri et al. showed that the crude death rate in all age groups under 75 years has decreased from 2006 to 2015, and this negative trend is expected to continue until 2035 [1]. In addition, this trend is increasing in the age group over 75 years. According to the World Bank, Iran’s crude mortality rate has changed from 5.14 in 2006 to 4.54 in 2015 [17]. According to the Global Development Indicators, Iran’s crude mortality rates in 2006 and 2015 were reported as 5.14 and 4.55, respectively, indicating a declining crude death rate in Iran [18].
Recently, due to population aging, much attention has been paid to changes in the age structure. However, the issue of the country’s aging population is not yet severe, but it will soon become a focus of demographic and social problems. According to studies, if any population policy is implemented in the near future, Iran will face population aging. In other words, population aging will be inevitable in the future. It is obvious that, from now on, the government must pay attention to older people in macro and long-term planning and policy-making. In addition, policymakers and planners must make arrangements for the social and health well-being of the elderly [19].
The main limitation of this research is that the models do not consider the results of perceived changes, such as medical advances in improving life expectancy, and the prevalence of infectious diseases, such as COVID-19, may interfere in the accuracy of the model’s predictions for the horizon.
In addition, this study was designed before the onset of the COVID-19 pandemic, and due to changes in the mortality rates caused by this pandemic, investigating the trend of mortality during this pandemic and comparing its results with the present study is recommended.
Conclusion
The results of this study showed that mortality in all age and sex groups from 2019 to 2028 has a downward trend with a low slope. Therefore, Golestan Province is facing an increase in elderly population and the prevalence of non-communicable diseases, such as diabetes, cardiovascular disease and cancer. Therefore, this issue should be considered in the country’s policies and plans, and arrangements should be made to support the health and well-being of older people. With current trends in resource allocation, the needs of many people remain unmet. Therefore, we must look beyond the health system and promote public health through a comprehensive preventive approach using appropriate measures and policies to prevent population aging and non-communicable diseases. Policymakers must provide solutions to reduce the incidence and prevalence of these diseases, such as self-care education, creating opportunities for lifestyle changes in nutrition, increasing physical activity, reducing psychological stress, screening, and ongoing follow-up in case of illness.
Ethical Considerations
Compliance with ethical guidelines
This study was approved by the Ethics Committee of Golestan University of Medical Sciences, Gorgan, Iran (Code: IR.GOUMS.REC.1399.270).
Funding
This study was financially supported by Golestan University of Medical Sciences, Gorgan, Iran (Grant No.: 111436).
Authors' contributions
Conceptualization and supervision: Alireza Heidari and Zahra Khatirnamani; Methodology: Zahra Khatirnamani and Sajad Khodabandelu; Investigation: Zahra Khatirnamani; Original draft: Zahra Khatirnamani and Narges Rafiei; Review and editing: Zahra Khatirnamani; Data collection: Masoumeh Gholami; Data analysis: Zahra Khatirnamani and Sajad Khodabandelu; Funding acquisition and Resources: Alireza Heidari; Writing: All authors.
Conflict of interest
The authors declared no conflicts of interest.
Acknowledgments
The authors acknowledge Golestan University of Medical Sciences for providing the datasets used in this study.
References
Reliable information on the causes of death, mortality trends, and their changes is one of the most basic principles of planning, management, and evaluation of health sectors in all countries [1, 2]. Modeling and predicting crude death rates at any particular age has long been considered by demographers as a general indicator of mortality rates. Therefore, any attempt to increase the accuracy of predicting future mortality patterns will have a direct impact on improving the results of each of the above applications [3].
Most new methods for predicting mortality use two-factor models with age and period as two factors. The Lee-Carter (LC) model is one of these two-factor models for predicting mortality [4, 5]. The emergence of the LC method dates back to a change in life expectancy patterns in the United States (US) in 1900. This led to Lee and Carter’s research on modeling and predicting the long-term mortality rate of the entire US population, called population time modeling and forecasting. Although this method was based on US mortality data from 1900 to 1987, it performed very well in modeling and predicting long-term mortality rates in many developed countries, including Chile (1994), Japan (1996), England (2003), Sweden (2004) and Italy (2005) [3]. In summary, this method predicts mortality by age and length of period for a single population as a general time trend, an age component, and the rate of change over time in terms of age [5]. Overall, one of the strengths of the LC and other generalization methods is their use in situations where mortality rates show a linear trend across age groups [6].
The LC method, as a generalization method, is a combination of an affluent demographic model (with the fewest parameters) and time-series methods. Although in this method, as in other generalization methods, information about the effects of medical advances, behavioral or social, is not included in the mortality rate, it is superior to other extrapolation methods for several reasons. First, a large part of the changes in the total mortality rate in developed countries is covered by this model, Second, the model parameters are easy to interpret. Third, this method, in addition to predicting mortality rates over time, can also provide the corresponding confidence intervals. In demographic texts, this method has been described as a prominent statistical model for long-term prediction of the population’s total mortality rate [7].
The results of the study using the LC model showed that the mortality trend from accidents and respiratory diseases in Golestan Province, Iran, is increasing; therefore, it is necessary to plan to reduce accidents and incidents, and in this regard, specific strategies should be developed and implemented by explaining the role of all stakeholders [8].
The mortality rate in age groups in Golestan Province shows a linear trend, and considering that the LC method has been introduced as a leading model for predicting mortality [9, 10]. Therefore, this study aimed to model and predict mortality rates using the LC model.
Methods
This study was a secondary analysis based on available data. The study population included all deaths registered in the health department of Golestan University of Medical Sciences during 2011-2018. Information about mortality (cause of death, age, and sex) was obtained from the golestan death registry as an Excel file.
The disease classification system is based on ICD-10. Causes of death are determined and coded by the International Statistical Classification of Diseases and Related Health Problems. To correct codes for impossible causes of death by age and sex, and for possible causes of death in terms of fatality, the global disease load study framework for 2010 and 2013 was used [11-13].
For demographic estimates in this paper, the mathematical method according to Equation 1 was used. Where Pt + n population in the second census, Pt population in the first census, n distance between the two censuses, and r is the annual population growth rate that is the basis of the calculations.
The crude death rate at age x and time t in a society is shown with Mx,t and is calculated using the following relationship (Equation 2):
Where dx,t , and , Lx,t represent the number of deaths and the population exposed to the event of death at age x and time t for that community, and t1 for the first time, and N is the number of ages or age groups under study.
In practice, the mortality rate is obtained by dividing the number of deaths of each age by the middle population of that age. The middle population at any age estimates the population at risk of death based on population and housing censuses.
The structure of the proposed model of LC is as Equation 3:
Where Lnmx,t indicates the natural logarithm of death rates observed at age x and in year t, and, ax, bx and kt are age- and time-dependent parameters, respectively. ax, indicates the average time logarithm of death rates at age x, in other words, εx,t illustrates the overall shape of the mortality rate’s curve; kt is the mortality index in year t which indicates the primary trend in the natural logarithm of mortality rates for all ages over time; and bx shows the rate of changes in the mortality rate logarithm at age x to (per) changes in the mortality index over time. Component, εx,t is equal to the component error at age x and time t. According to Equation 3, the following relationship is obtained (Equation 4):
According to Equation 3, if the kt mortality index decreases linearly over time, the age-specific mortality rate will decrease at a constant exponential rate. The error terms, εx,t, have a Gaussian distribution with zero mean and variance σ2ε and represent part of the changes in age-specific mortality rate that cannot be explained by the model. Lee and Carter believe that the parameter covers the major scatter in the data and, as a result, the error term’s variance is constant over time [14].
After estimating the model parameters and age-specific mortality rates, the LC model is employed to predict mortality rates. For this purpose, Lee and Carter first developed a time-series model for kt and then predicted the number of kt, they predicted the mortality rate mx,t for each age group, and at any particular time. For the prediction, first kt is predicted applying time-series modeling, and its future values are then used to predict k_ [t+1]. Finding the best model for kt is crucial because an inappropriate model will result in incorrect predictions of the future behavior of the mortality rate. The random walk model with drift for kt is presented as Equation 5:
In the second stage of prediction, values for age-specific mortality rates are anticipated. Regardless of the error term, changes in the rate of deaths in a particular year are completely dependent on each other and are linear functions of the time variable parameter of kt. Therefore, to calculate confidence intervals of mortality rates in any age group and in any given year, only kt confidence interval should be calculated. The prediction of mortality rates for the estimated parameter values βx and αx and predicted values kt is calculated according to the Equation 6 [14]:
All steps of the model analysis and fitting were performed using Demography software, version 18.1 and StMoMo packages in R software, version 3/6/2.
Results
During 2011-2018, 60 082 deaths occurred in Golestan Province due to various reasons. The Mean±SD of the deceased was 58.92±26.64 years (57.25±26.62 years in men and 61.30±26.32 years in women). A total of 43.2% were women and 56.8% were men.
Empirical analysis for data
In this section, the possibility of using the LC method to predict population mortality has been investigated. The classic LC model and its extensions were proportional to the mortality rate matrix of Golestan Province from 2011 to 2018. This model was fitted using a Poisson error structure. Duplicate algorithms were used to estimate the parameters. Also, using the autoregressive integrated moving average (ARIMA) framework, A multivariate random walk with drift, a variable index with mortality time was predicted. In the final stage, the death rate in Golestan Province was predicted for the next ten years.
Data source
The annual number of deaths by age is available in 17 age groups (ranging from less than one year to over 80 years old, with an interval of 4 years) for the population of Golestan Province from 2011 to 2018. The total number of exposures to the risk of the death is necessary to calculate empirical mortality rate. Therefore, x (x1, x17) and t (t1, t8), so that xi; i=1, …, 17, i-th age group and tj; j=1, …, 8, j shows the seventh year from 2011 to 2018.
An investigation of the death rate trend from 2011 to 2018 shows that, across all age groups, this trend has been constant; therefore, one of the main assumptions of the LC model was established.
By dividing the number of deaths by the total number of people at risk of death, the experimental mortality rate was obtained and used to fit the LC model. Table 1 presents the death rate per capita for men and women from 2011 to 2018. The mortality rate is high in the first age group, which includes infants, but decreases for the next age group and then increases for the older age groups. In addition, the latest age groups, which include the elderly (age group>65 years), have the highest death rates. Therefore, these tables present the same trends in the real world.
Estimation of LC model parameters
The estimation of model parameters is the first step after data collection. These estimates can then be used to predict future mortality. Table 2 presents the estimated parameter values αx and βx for the whole population and for men and women. Figure 1 also plots past values with time-series model predictions and associated confidence intervals for men, women, and the total population.
In all age groups, αx values are higher for men than for women, indicating that the overall death rate for men is higher than for women. Under the LC method, αx is the average of the log values of the mortality rate and is estimated by averaging over all years. The first and last age groups, including infants and older people, have the highest αx values. This means that, as expected, these age groups have more excellent age effects on mortality. The coefficients of women of all ages are below that of others, reflecting the fact that mortality for women is lower on average. According to previous studies, after the age of 4 years, the mortality rate gradually decreases, and after the age of 80 years, it increases [15].
The bx coefficients describe the relative sensitivity of death rates to variation in the kt parameter. It is not surprising that sets of coefficients for all three cases look pretty similar for each age group. Because of the normalization, their absolute levels have no particular meaning. With N age groups, if βx=βy=1/N for all x, y, then all the rates would move up and down proportionately, maintaining constant ratios to one another. However, it can be observed that some ages are much more sensitive than others. The smaller the age, the greater its sensitivity to variations in the t k parameter. The exponential rate of change of an age group’s mortality is proportional to the bx values (Equation 7):
If kt decreases linearly with time, then will be constant and each mxt will decrease with its constant exponential velocity.
Table 2 also presents the estimated βx values, which are higher for 0 to 4-year age group than for the other groups, indicating that the mortality rate in this age group is very different and that this group plays a significant role in kt change. Also, the following influential age group is the last one, which includes older people. When βx is significant for some x, the mortality rate at age x changes significantly. When the general mortality rate changes (e.g. x=0 for infant mortality) and when βx is small, the rate of change at that age changes slightly. This often happens in the case of mortality at older ages.
kt decreases directly from 2011 to 2012; however, for reasons unclear to us, it increases from 2013 to 2015 and 2016 to 2018 only to have a downward trend again. If we compare male and female mortality, we can see that male mortality is higher than female mortality; therefore, work on possible improvements in reducing male mortality can be more evident than in females.
Residuals
Figure 1 shows the residuals of the LC model for the male, female, and total population in Golestan Province. In these figures, lighter colors indicate smaller residuals and darker colors indicate larger residuals. As shown in the plot of independent residuals, residuals with similar, relatively large values are grouped together, indicating the spatial structure of the residuals. Considering this spatial correlation structure for model residues and estimating it is vital in analyzing mortality data.
In the second stage of prediction, age-specific mortality rate values are predicted. If the error terms are omitted, the changes in mortality rates in a given year are wholly interdependent and a function of the time-varying parameter kt. Therefore, to calculate the confidence interval for the mortality rate in each age group and each specific year, it is sufficient to calculate the confidence interval.
Forecast
At this point, we can proceed directly to the next step: modeling kt as a time-series process that depends on time. We can fit the time series model with kt to predict them over the desired time period. In other words, we treat this time-dependent parameter as a time series and use the Box and Jenkins method [16] to find suitable time series models for it, after which we can predict it. To use the Box and Jenkins method for time-series forecasting, the time series must be stationary, that is, it must have a constant mean, variance, and correlation over time.
Now, we can use the ARIMA model selected in R software to generate a forecast of the kt parameter for the next ten years, based on data from 2011 to 2018.
Once we have predicted the mortality index, we can generate values related to the mortality rate. Also, the expected mortality rates, classified by age, are presented in Table 3 separately for the total population, men, and women for the years 2019-2028. According to the results, the mortality trend in all age and sex groups during 2019-2028 is expected to be downward. As predicted in 2028, the mortality rate in the age group over 80 years reached from 107.14 to 72.43 in the total population, from 90.12 to 42.11 in men, and from 101.49 to 52.25 in women (per 1000 population). It is also predicted that the mortality rate in the age group of less than five years will decrease from 2.24 to 0.62 in the total population, from 2.35 to 0.84 in men, and from 2.07 to 0.94 in women (per 1000 population).
Discussion
The present study is an applied study to model and predict mortality. First, census and death data have been evaluated. After modeling changes in mortality between 2011 and 2018 and recognizing the mortality pattern, mortality rates for Golestan Province up to 2028 have been predicted. The findings of this paper show that the power and efficiency of the LC model in predicting mortality in Golestan Province is high. The LC model is an alternative method that can directly predict mortality by age, and the predicted figures can be easily converted into any mortality indicator, including life expectancy, by constructing a real-life table. This method is superior to other methods of directly predicting mortality or life expectancy for several reasons. First, if each rate is best modeled by an ARIMA model, it needs to estimate many parameters. Second, by independently predicting each rate, it is necessary to calculate the number of N (N-1)/2 covariances of the error expressions (N is the number of age groups). Whereas in the LC method, since the mortality rate in different age groups in each year is a function of the parameter, a strong correlation is observed between this rate and the index, and the variance and covariance of the error expressions are determined by the selected model for kt. Third, independent forecasting of each rate makes it possible to combine rates and form unlikely age structures in the future. In contrast, in the LC model, since the trend in all age-specific mortality rates is modeled by the parameter, all estimated rates will belong to a life table [3]. Despite all the advantages that can be listed for the LC model, and although the evaluation of the results obtained in many applications of this model shows the high efficiency of the model, it should not be forgotten that the assumptions related to the fixed age pattern in this model are not met in some cases.
It is expected that the mortality rate in all age and sex groups during the years 2019 -2028 have a downward trend in Golestan province. Jahangiri et al. showed that the crude death rate in all age groups under 75 years has decreased from 2006 to 2015, and this negative trend is expected to continue until 2035 [1]. In addition, this trend is increasing in the age group over 75 years. According to the World Bank, Iran’s crude mortality rate has changed from 5.14 in 2006 to 4.54 in 2015 [17]. According to the Global Development Indicators, Iran’s crude mortality rates in 2006 and 2015 were reported as 5.14 and 4.55, respectively, indicating a declining crude death rate in Iran [18].
Recently, due to population aging, much attention has been paid to changes in the age structure. However, the issue of the country’s aging population is not yet severe, but it will soon become a focus of demographic and social problems. According to studies, if any population policy is implemented in the near future, Iran will face population aging. In other words, population aging will be inevitable in the future. It is obvious that, from now on, the government must pay attention to older people in macro and long-term planning and policy-making. In addition, policymakers and planners must make arrangements for the social and health well-being of the elderly [19].
The main limitation of this research is that the models do not consider the results of perceived changes, such as medical advances in improving life expectancy, and the prevalence of infectious diseases, such as COVID-19, may interfere in the accuracy of the model’s predictions for the horizon.
In addition, this study was designed before the onset of the COVID-19 pandemic, and due to changes in the mortality rates caused by this pandemic, investigating the trend of mortality during this pandemic and comparing its results with the present study is recommended.
Conclusion
The results of this study showed that mortality in all age and sex groups from 2019 to 2028 has a downward trend with a low slope. Therefore, Golestan Province is facing an increase in elderly population and the prevalence of non-communicable diseases, such as diabetes, cardiovascular disease and cancer. Therefore, this issue should be considered in the country’s policies and plans, and arrangements should be made to support the health and well-being of older people. With current trends in resource allocation, the needs of many people remain unmet. Therefore, we must look beyond the health system and promote public health through a comprehensive preventive approach using appropriate measures and policies to prevent population aging and non-communicable diseases. Policymakers must provide solutions to reduce the incidence and prevalence of these diseases, such as self-care education, creating opportunities for lifestyle changes in nutrition, increasing physical activity, reducing psychological stress, screening, and ongoing follow-up in case of illness.
Ethical Considerations
Compliance with ethical guidelines
This study was approved by the Ethics Committee of Golestan University of Medical Sciences, Gorgan, Iran (Code: IR.GOUMS.REC.1399.270).
Funding
This study was financially supported by Golestan University of Medical Sciences, Gorgan, Iran (Grant No.: 111436).
Authors' contributions
Conceptualization and supervision: Alireza Heidari and Zahra Khatirnamani; Methodology: Zahra Khatirnamani and Sajad Khodabandelu; Investigation: Zahra Khatirnamani; Original draft: Zahra Khatirnamani and Narges Rafiei; Review and editing: Zahra Khatirnamani; Data collection: Masoumeh Gholami; Data analysis: Zahra Khatirnamani and Sajad Khodabandelu; Funding acquisition and Resources: Alireza Heidari; Writing: All authors.
Conflict of interest
The authors declared no conflicts of interest.
Acknowledgments
The authors acknowledge Golestan University of Medical Sciences for providing the datasets used in this study.
References
- Jahangiri K, Aghamohamadi S, Khosravi A, Kazemi E. Trend forecasting of main groups of causes-of-death in Iran using the lee-carter model. Medical Journal of the Islamic Republic of Iran. 2018; 32:124. [DOI:10.14196/mjiri.32.124] [PMID]
- Heidari A, Javad Kabir M, Khatirnamani Z, Jafari N, Gholami M, Reza Honarvar M, et al. Years of life lost due to accidents and injuries in Iran: A trend of five years (2014-2018). Journal of Emergency Medicine, Trauma & Acute Care. 2022; 2022(2):2. [DOI:10.5339/jemtac.2022.2]
- Zokaei M, Alehoseini FS. [A comparison of singular spectrum analysis method with methods in lee-carter family in forecasting mortality rate (Persian)]. Iranian Journal of Insurance Research. 2013; 3(1):23-51. [DOI:10.22056/ijir.2014.01.02]
- Currie ID, Durban M, Eilers PH. Smoothing and forecasting mortality rates. Statistical Modelling. 2004; 4(4):279-98. [DOI:10.1191/1471082X04st080oa]
- Lee RD, Carter LR. Modeling and forecasting US mortality. Journal of the American Statistical Association. 1992; 87(419):659-71. [DOI:10.1080/01621459.1992.10475265]
- Booth H, Hyndman RJ, Tickle L, De Jong P. Lee-carter mortality forecasting: A multi-country comparison of variants and extensions. Demographic Research. 2006; 15:289-310. [DOI:10.4054/DemRes.2006.15.9]
- Deaton AS, Paxson C. Mortality, income, and income inequality over time in Britain and the United States. In: Wise DA, editor. Perspectives on the economics of aging. Chicago: University of Chicago Press; 2004. [DOI:10.7208/9780226903286-008]
- Heidari A, Kabir MJ, khodabandelu S, Jafari N, Khatirnamani Z, Gholami M. [Modeling and prediction of the mortality trend due to accidents in golestan province based on the lee-carter model (Persian)]. Journal of Health Research in Community. 2022; 8(3):1-10. [Link]
- Di Cesare M, Murphy M. Forecasting mortality, different approaches for different cause of deaths? The cases of lung cancer; influenza, pneumonia, and bronchitis; and motor vehicle accidents. British Actuarial Journal. 2009; 15(S1):185-211. [DOI:10.1017/S1357321700005560]
- Aghamohamadi S. [Forecasting death trend of endocrine, nutritional, and metabolic diseases in Iran during 2006 to 2035 (Persian)]. Iranian Journal of Epidemiology. 2018; 14(1):63-73. [Link]
- Naghavi M, Makela S, Foreman K, O’Brien J, Pourmalek F, Lozano R. Algorithms for enhancing public health utility of national causes-of-death data. Population Health Metrics. 2010; 8:9. [DOI:10.1186/1478-7954-8-9] [PMID]
- Lozano R, Naghavi M, Foreman K, Lim S, Shibuya K, Aboyans V, et al. Global and regional mortality from 235 causes of death for 20 age groups in 1990 and 2010: a systematic analysis for the global burden of disease study 2010. The Lancet. 2012; 380(9859):2095-128. [DOI:10.1016/S0140-6736(12)61728-0] [PMID]
- Heidari A, Kabir MJ, Khatirnamani Z, Rafiei N, Gholami M. Evaluation mortality trends and years of life lost due to causes of death in Northern Iran, 2011-2018. International Journal of Health Management And Development. 2024 Oct 10;1(2):14-7. [DOI:10.29252/IJHMD.1.2.14]
- Lee R. The Lee-Carter method for forecasting mortality, with various extensions and applications. North American Actuarial Journal. 2000; 4(1):80-91. [DOI:10.1080/10920277.2000.10595882]
- Heidari A, Kabir MJ, Khatirnamani Z, Jafari N, Gholami M, Hosseinzadeh S, et al. [Epidemiological study of registered deaths in Golestan province; In 2018 (Persian)]. Scientific Journal of Nursing, Midwifery and Paramedical Faculty. 2020; 6(2):69-80. [Link]
- Makridakis S, Hibon M. ARMA models and the Box-Jenkins methodology. Journal of Forecasting. 1997; 16(3):147-63. [DOI:10.1002/(SICI)1099-131X(199705)16:33.0.CO;2-X]
- Nguyen PY, Ajisegiri WS, Costantino V, Chughtai AA, MacIntyre CR. Reemergence of human monkeypox and declining population immunity in the context of urbanization, Nigeria, 2017-2020. Emerging Infectious Diseases. 2021; 27(4):1007. [DOI:10.3201/eid2704.203569]
- World Bank. World development indicators. [Internet]. 2016 [Updated 2017 September 15]. Available from: [Link]
19. Fathi, E, Nasiripour M, Ghaderi S, Nezamivand Z. [Investigating the trend of changes in the structure and composition of the country’s population and its future up to the 2051 solar horizon Based on the results of the general population and housing census of 2016 (Persian)]. Tehran: Statistical Center of Iran; 2016. [Link]
Type of Study: Orginal Article |
Subject:
● Disease Control
Received: 2024/10/7 | Accepted: 2025/03/5 | Published: 2026/01/1
Received: 2024/10/7 | Accepted: 2025/03/5 | Published: 2026/01/1
| Rights and permissions | |
 |
This work is licensed under a Creative Commons Attribution-NonCommercial 4.0 International License. |

This is an open access article distributed under the terms of the Creative Commons Attribution License (CC-By-NC), which permits use, distribution, and reproduction in any medium, provided the original work is properly cited and is not used for commercial purposes.
Contact Information