

Volume 16, Issue 4 (Jul & Aug 2026)
J Research Health 2026, 16(4): 379-390 |
Back to browse issues page



Ethics code: IR.TUMS.MEDICINE.REC.1400.788


Download citation:
BibTeX | RIS | EndNote | Medlars | ProCite | Reference Manager | RefWorks
Send citation to:


BibTeX | RIS | EndNote | Medlars | ProCite | Reference Manager | RefWorks
Send citation to:
Emami O, Dorosty Motlagh A, Takian A, Mousa Farkhani E. Indirect Assessment of Diet Quality Trends in Iranian Households, 1991–2020. J Research Health 2026; 16 (4) :379-390
URL: http://jrh.gmu.ac.ir/article-1-2809-en.html
URL: http://jrh.gmu.ac.ir/article-1-2809-en.html


1- Department of Food and Nutrition Policy, School of Nutritional Sciences and Dietetics, Tehran University of Medical Sciences, Tehran, Iran.
2- Health Equity Research Center (HERC), Tehran University of Medical Sciences (TUMS),Tehran, Iran.
3- Department of Food and Nutrition Policy, School of Nutritional Sciences and Dietetics, Tehran University of Medical Sciences, Tehran, Iran. & Department of Global Health, Center of Excellence for Global Health, School of Public Health, Tehran University of Medical Sciences (TUMS), Tehran, Iran. ,dorostim@tums.ac.ir
4- Department of Epidemiology and Biostatistics, School of Health, Mashhad University of Medical Science, Mashhad, Iran.
2- Health Equity Research Center (HERC), Tehran University of Medical Sciences (TUMS),Tehran, Iran.
3- Department of Food and Nutrition Policy, School of Nutritional Sciences and Dietetics, Tehran University of Medical Sciences, Tehran, Iran. & Department of Global Health, Center of Excellence for Global Health, School of Public Health, Tehran University of Medical Sciences (TUMS), Tehran, Iran. ,
4- Department of Epidemiology and Biostatistics, School of Health, Mashhad University of Medical Science, Mashhad, Iran.
Keywords: Healthy eating index (HEI)-2015, Diet quality, Hierarchical age-period-cohort (HAPC), Household income and expenditure survey
Full-Text [PDF 804 kb]
(66 Downloads)
| Abstract (HTML) (679 Views)
Estimation of individual consumption
The step-by-step process for estimating individual per capita consumption is as follows:
1) Calculation of the amount of food purchased per day (monthly values are provided). 2) Utilizing conversion factors from live animals to carcasses (obtained from the United States Department of Agriculture (USDA) “food yields summarized by different stages of preparation”) [19]. 3) Utilizing conversion factors from raw to cooked [19, 20]. 4) Utilizing conversion factors for the net amount of food items (e.g. excluding pineapple skin) [19]. 5) Utilizing waste factors for food items [21]. 6) Removal of void and unnecessary codes, such as rents. 7) Utilizing the AME method [22]. 8) Calculation of energy, macronutrients, and food servings (according to the 13 components of the HEI Score, using NUTRITIONIST IV software adapted to analyze Iranian food consumption). 9) Removal of outlier data (less than 500 or more than 3500 kilocalories for women and less than 800 or more than 4200 kilocalories for men) [11]. 10) Calculation of the HEI Score for individuals. 11) Utilizing household weights and calculating the weighted average of HEI.
Modeling
HAPC analysis
HAPC analysis is a statistical technique used to identify and examine the multifaceted influences of age, period, and cohort on data gathered over time and across various units. In the context of household income-expenditure data, both fixed- and random effects models can be utilized, each with a distinct approach to parameter estimation [14].
Fixed effects model: This model assumes that unobservable variation across units (such as individuals, firms, or countries) remains constant and unaltered over time. It seeks to uncover unique and persistent effects for each unit [12].
Random effects model: This model assumes that unobservable differences between units are random and independent of the explanatory variables. It is well-suited for analyzing data in which variation among units follows a random distribution [12].
In this study, both period (year) and generational (cohort) effects were incorporated as random effects. Periods were defined as one-year intervals, while generational groups (cohorts) were categorized based on five-year increments.
Given the variability of food intake across different time periods and age cohorts, we used the HAPC analysis model proposed by Yang and Land (2006) to examine these changes. In cross-classified random effects modeling (CCREM), the HAPC method is particularly useful as it shows the simultaneous effects of three influential factors, unlike linear regression methods. This method, also known as the Mixed Fixed-Random Effect method, has traditionally been used to study diseases; however, we applied it for the first time to analyze changes in the HEI [14].
We performed the analysis using two models:
1) Model 0: No variables were entered into the model. 2) Model 1: Variables such as the age of the head of the household (representative of the household), the square of the age of the head of the household (to account for nonlinear age effects), household income quartile, place of residence, gender of the head of the household, literacy level of the head of the household, occupational activity status of the head of the household, home ownership, and marital status of the head of the household were included.
To address collinearity, we used principal component analysis to combine correlated household characteristics (Household size, home area, number of literate household members, number of students, and number of employed household members, e.g.) into a smaller number of components, which were then included in the regression model.
The model formulation is as Equation 1 [14]:
1. Yijk=γ0+β1 Age of the head of householdijk+β2 Age of the head of household2 ijk+β3 Economic statusijk+β4 Gender of the head of householdijk+β5 Place of residence ijk+β6 Literacy of the head of householdijk+β7 Marriage status of the head of householdijk+β8 PCA_factorijk+β9 Homeownership statusijk+β10 Employment activityijk+u0k+v0j+eijk with u0 j~N(0, τu) v0 k ~N(0, τv) eijk~N(0,σ2)
for
i=1, 2, njk individuals within cohort j and period k; j=1., 19 birth cohorts; k=1., 30 survey years. u=periods, v=Cohorts
To ensure model stability, period effects (annual intervals) and cohort effects (5-year intervals) were modeled as random effects without smoothing, as the large sample size (n=665,254) mitigated overfitting risks. The CCREM addresses the age-period-cohort identification problem by modeling age as a fixed effect and period/cohort as random effects, following Yang and Land (2006) [14] The PCA_factor was derived from less influential variables (household size, home area, number of literate people, number of students, number of employed people) using Principal Component Analysis, retaining components explaining ≥70% of variance to reduce collinearity. The HAPC analysis was implemented using SAS software, version 9.4, PROC MIXED, with the restricted maximum-likelihood (REML) method.
In regression models, variables are sometimes squared to capture nonlinear relationships between the explanatory and dependent variables. For age, this approach allows modeling its effect at different ages, rather than assuming a linear effect across all ages.
Model 1, incorporating the variables mentioned, was estimated and analyzed using REML with the PROC MIXED procedure in SAS software, version 9.4. Charts were created using Microsoft Excel software, version 2016.
Results
The average household size over the 30-year study period was 4.27±1.98. The mean annual household income was 1,338,688,065 Rials (approximately $31,851 at the time of writing). The average age of the household head was 48.88±15.30 years, and the mean residential area was 86.97±51.67 m². Rural households accounted for 43.2% of the sample, and 10.3% of households were female-headed.
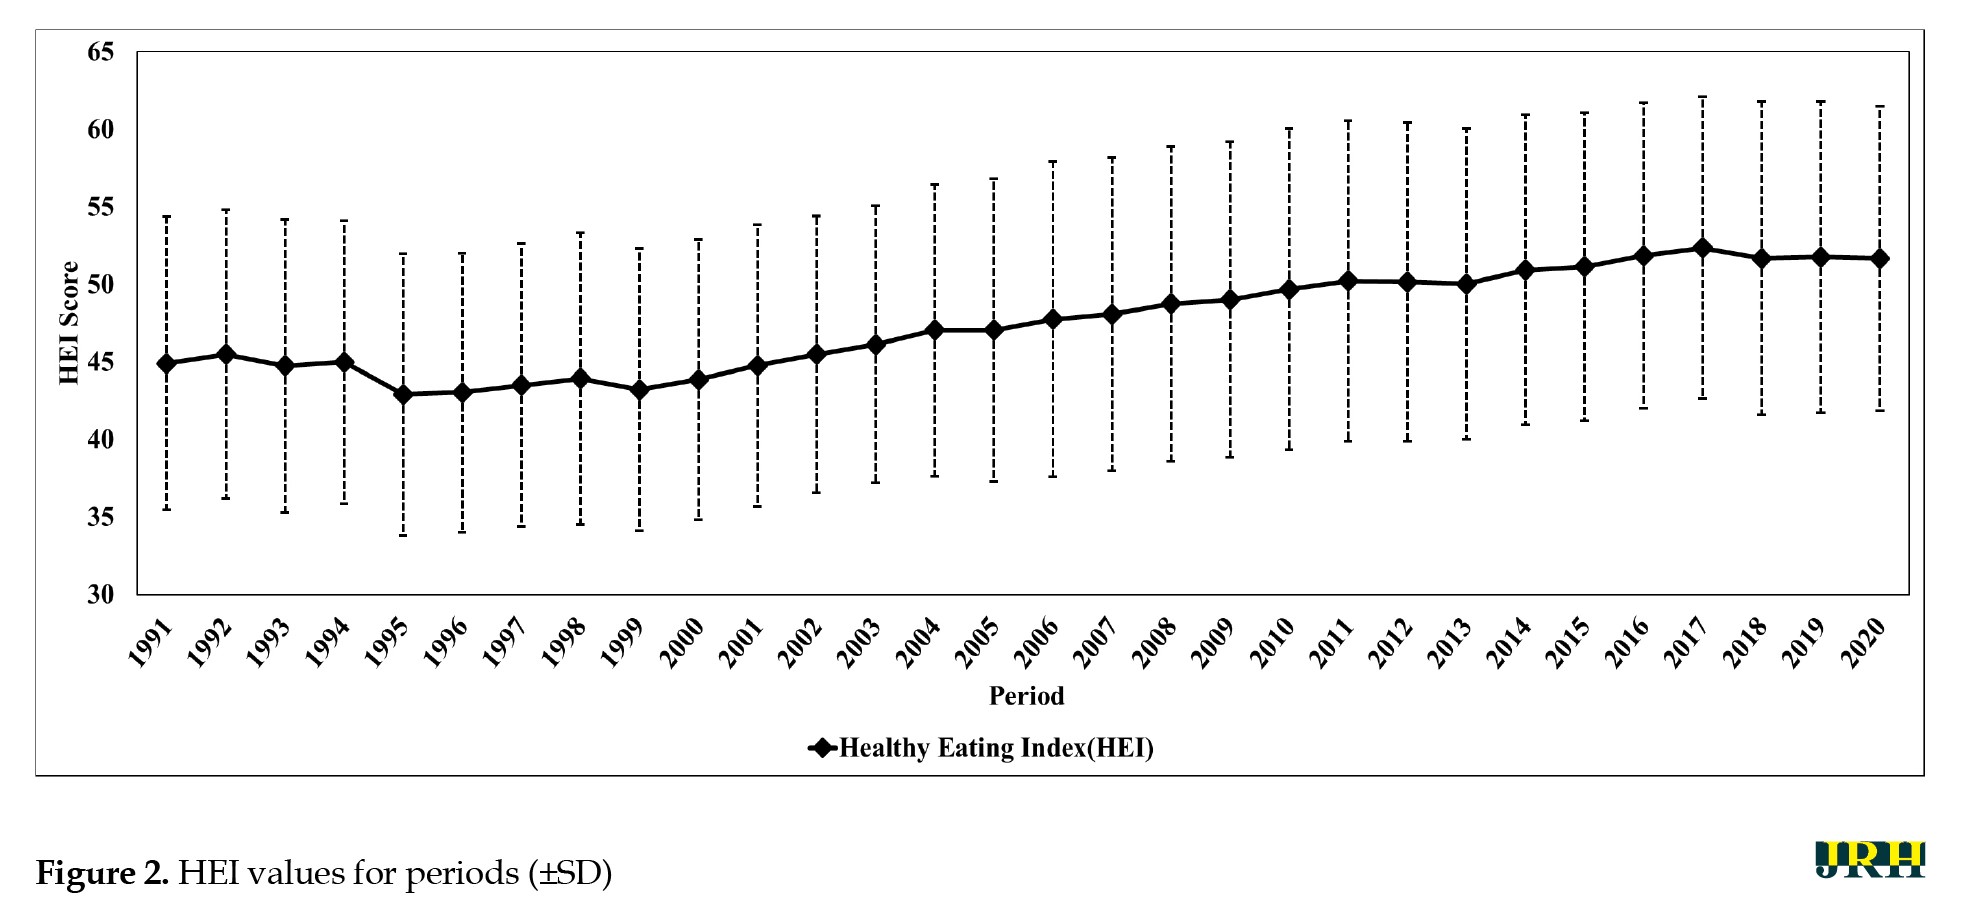
The average national HEI score over the 30 years was 48.39±10.25. Figure 2 shows the yearly trend in HEI scores, along with standard deviation bands.
Full-Text: (5 Views)
Introduction
The healthy eating index (HEI) is a valuable tool in health and nutrition research, providing a measure of diet quality aligned with key recommendations from the Dietary Guidelines for Americans [1]. Although developed for the US context, the HEI-2015—the most current version—has been adapted to assess dietary intake in diverse populations aged 2 years and older, including non-Western settings [2]. The HEI-2015 consists of 13 components that reflect different food groups and key recommendations in the 2015-2020 Dietary Guidelines [3].
The HEI uses a scoring system to evaluate dietary intake patterns. The scores range from 0 to 100. An ideal overall HEI score of 100 reflects that the set of foods aligns with key dietary recommendations from the Dietary Guidelines. This can help identify areas where improvements are needed and monitor changes in dietary patterns over time [4]. The HEI-2015 provides a snapshot of overall diet quality and indicates that the average diet in the United States does not conform to dietary recommendations [3]. Each step closer to a diet that aligns with dietary guideline recommendations can help reduce the risk of developing diet-related chronic diseases, such as heart disease, type 2 diabetes, and cancer [5-7]. The hierarchical age-period-cohort (HAPC) analysis is a statistical method that decomposes trends in behaviors or health outcomes, such as healthy eating, into three distinct components: age, period, and cohort effects. This approach allows researchers to identify the various influences that act on a population over time [8].
Age effects can refer to the behavioral differences between different age groups regarding healthy eating. Period effects represent changes that affect all age groups during a specific period. Cohort effects capture the unique experiences shared by a particular generation throughout their history and social environment.
This study aimed to examine age, period, and cohort effects on dietary quality using the HEI-2015, employing data from the household income and expenditure survey (HIES) conducted by the Statistical Center of Iran. HAPC analysis distinguishes these effects to inform targeted dietary interventions. HAPC analysis of HEI can provide valuable insights into changes in dietary quality over three decades, enabling a more nuanced understanding of the effects of age, period, and cohorts. This analysis can inform strategies for improving dietary policies and programs.
Methods
Sample
Data from 926,339 households in income-expenditure surveys conducted between 1991 and 2020 were analyzed. A total of 665,254 households were included, while 261,085 were excluded due to energy intake values falling outside the normal range (defined as <500 or >3500 kcal for women and <800 or >4200 kcal for men, as outliers) [9-11].
Dietary assessment
This was a repeated cross-sectional study. By applying a set of statistical and nutritional techniques, we converted the HIES data of Iranian society from 1991 to 2020 into household food consumption data. The HIES questionnaire, used for both urban and rural populations, consists of four sections, with section three dedicated to household expenses, including food expenses. We used data from 1991 to 2020 because fewer changes were observed in the questionnaire during this period [12].
HIES data serve as a proxy for food consumption, as direct dietary intake data were unavailable, consistent with methodologies used in similar settings [13-15]. To generalize the sample from each urban and rural area to the entire community, a coefficient or weight was determined for each household based on economic and social criteria [16]. This coefficient, calculated by the Statistical Center of Iran, was used to calculate the HEI.
This study adopted the adult male equivalent (AME) as recommended by the Food and Agriculture Organization (FAO) and World Health Organization (WHO). AMEs represent the energy requirements of an adult male (18-30 years old, moderate physical activity) relative to other household members. Household AME requirements were calculated based on each member’s age and sex. To determine the daily intake per AME for each food item, the total amount of the item was divided by the total number of household AMEs. This approach simplifies calculations by converting all household members to a common energy unit (AME) [17, 18].
Furthermore, the FAO’s estimated food waste percentages for each food group were incorporated during the consumption step, accounting for food acquired through purchase, gifts, donations, or household production. This methodology provides a more accurate estimate of actual household food consumption [17].
HEI
HEI comprises 13 components, divided into two sections: Adequacy (nine items) and moderation (four items). The adequacy components include foods that should be consumed more for optimal health, while the moderation components include foods that should be limited to maintain good health (Figure 1) [1].
The healthy eating index (HEI) is a valuable tool in health and nutrition research, providing a measure of diet quality aligned with key recommendations from the Dietary Guidelines for Americans [1]. Although developed for the US context, the HEI-2015—the most current version—has been adapted to assess dietary intake in diverse populations aged 2 years and older, including non-Western settings [2]. The HEI-2015 consists of 13 components that reflect different food groups and key recommendations in the 2015-2020 Dietary Guidelines [3].
The HEI uses a scoring system to evaluate dietary intake patterns. The scores range from 0 to 100. An ideal overall HEI score of 100 reflects that the set of foods aligns with key dietary recommendations from the Dietary Guidelines. This can help identify areas where improvements are needed and monitor changes in dietary patterns over time [4]. The HEI-2015 provides a snapshot of overall diet quality and indicates that the average diet in the United States does not conform to dietary recommendations [3]. Each step closer to a diet that aligns with dietary guideline recommendations can help reduce the risk of developing diet-related chronic diseases, such as heart disease, type 2 diabetes, and cancer [5-7]. The hierarchical age-period-cohort (HAPC) analysis is a statistical method that decomposes trends in behaviors or health outcomes, such as healthy eating, into three distinct components: age, period, and cohort effects. This approach allows researchers to identify the various influences that act on a population over time [8].
Age effects can refer to the behavioral differences between different age groups regarding healthy eating. Period effects represent changes that affect all age groups during a specific period. Cohort effects capture the unique experiences shared by a particular generation throughout their history and social environment.
This study aimed to examine age, period, and cohort effects on dietary quality using the HEI-2015, employing data from the household income and expenditure survey (HIES) conducted by the Statistical Center of Iran. HAPC analysis distinguishes these effects to inform targeted dietary interventions. HAPC analysis of HEI can provide valuable insights into changes in dietary quality over three decades, enabling a more nuanced understanding of the effects of age, period, and cohorts. This analysis can inform strategies for improving dietary policies and programs.
Methods
Sample
Data from 926,339 households in income-expenditure surveys conducted between 1991 and 2020 were analyzed. A total of 665,254 households were included, while 261,085 were excluded due to energy intake values falling outside the normal range (defined as <500 or >3500 kcal for women and <800 or >4200 kcal for men, as outliers) [9-11].
Dietary assessment
This was a repeated cross-sectional study. By applying a set of statistical and nutritional techniques, we converted the HIES data of Iranian society from 1991 to 2020 into household food consumption data. The HIES questionnaire, used for both urban and rural populations, consists of four sections, with section three dedicated to household expenses, including food expenses. We used data from 1991 to 2020 because fewer changes were observed in the questionnaire during this period [12].
HIES data serve as a proxy for food consumption, as direct dietary intake data were unavailable, consistent with methodologies used in similar settings [13-15]. To generalize the sample from each urban and rural area to the entire community, a coefficient or weight was determined for each household based on economic and social criteria [16]. This coefficient, calculated by the Statistical Center of Iran, was used to calculate the HEI.
This study adopted the adult male equivalent (AME) as recommended by the Food and Agriculture Organization (FAO) and World Health Organization (WHO). AMEs represent the energy requirements of an adult male (18-30 years old, moderate physical activity) relative to other household members. Household AME requirements were calculated based on each member’s age and sex. To determine the daily intake per AME for each food item, the total amount of the item was divided by the total number of household AMEs. This approach simplifies calculations by converting all household members to a common energy unit (AME) [17, 18].
Furthermore, the FAO’s estimated food waste percentages for each food group were incorporated during the consumption step, accounting for food acquired through purchase, gifts, donations, or household production. This methodology provides a more accurate estimate of actual household food consumption [17].
HEI
HEI comprises 13 components, divided into two sections: Adequacy (nine items) and moderation (four items). The adequacy components include foods that should be consumed more for optimal health, while the moderation components include foods that should be limited to maintain good health (Figure 1) [1].
Estimation of individual consumption
The step-by-step process for estimating individual per capita consumption is as follows:
1) Calculation of the amount of food purchased per day (monthly values are provided). 2) Utilizing conversion factors from live animals to carcasses (obtained from the United States Department of Agriculture (USDA) “food yields summarized by different stages of preparation”) [19]. 3) Utilizing conversion factors from raw to cooked [19, 20]. 4) Utilizing conversion factors for the net amount of food items (e.g. excluding pineapple skin) [19]. 5) Utilizing waste factors for food items [21]. 6) Removal of void and unnecessary codes, such as rents. 7) Utilizing the AME method [22]. 8) Calculation of energy, macronutrients, and food servings (according to the 13 components of the HEI Score, using NUTRITIONIST IV software adapted to analyze Iranian food consumption). 9) Removal of outlier data (less than 500 or more than 3500 kilocalories for women and less than 800 or more than 4200 kilocalories for men) [11]. 10) Calculation of the HEI Score for individuals. 11) Utilizing household weights and calculating the weighted average of HEI.
Modeling
HAPC analysis
HAPC analysis is a statistical technique used to identify and examine the multifaceted influences of age, period, and cohort on data gathered over time and across various units. In the context of household income-expenditure data, both fixed- and random effects models can be utilized, each with a distinct approach to parameter estimation [14].
Fixed effects model: This model assumes that unobservable variation across units (such as individuals, firms, or countries) remains constant and unaltered over time. It seeks to uncover unique and persistent effects for each unit [12].
Random effects model: This model assumes that unobservable differences between units are random and independent of the explanatory variables. It is well-suited for analyzing data in which variation among units follows a random distribution [12].
In this study, both period (year) and generational (cohort) effects were incorporated as random effects. Periods were defined as one-year intervals, while generational groups (cohorts) were categorized based on five-year increments.
Given the variability of food intake across different time periods and age cohorts, we used the HAPC analysis model proposed by Yang and Land (2006) to examine these changes. In cross-classified random effects modeling (CCREM), the HAPC method is particularly useful as it shows the simultaneous effects of three influential factors, unlike linear regression methods. This method, also known as the Mixed Fixed-Random Effect method, has traditionally been used to study diseases; however, we applied it for the first time to analyze changes in the HEI [14].
We performed the analysis using two models:
1) Model 0: No variables were entered into the model. 2) Model 1: Variables such as the age of the head of the household (representative of the household), the square of the age of the head of the household (to account for nonlinear age effects), household income quartile, place of residence, gender of the head of the household, literacy level of the head of the household, occupational activity status of the head of the household, home ownership, and marital status of the head of the household were included.
To address collinearity, we used principal component analysis to combine correlated household characteristics (Household size, home area, number of literate household members, number of students, and number of employed household members, e.g.) into a smaller number of components, which were then included in the regression model.
The model formulation is as Equation 1 [14]:
1. Yijk=γ0+β1 Age of the head of householdijk+β2 Age of the head of household2 ijk+β3 Economic statusijk+β4 Gender of the head of householdijk+β5 Place of residence ijk+β6 Literacy of the head of householdijk+β7 Marriage status of the head of householdijk+β8 PCA_factorijk+β9 Homeownership statusijk+β10 Employment activityijk+u0k+v0j+eijk with u0 j~N(0, τu) v0 k ~N(0, τv) eijk~N(0,σ2)
for
i=1, 2, njk individuals within cohort j and period k; j=1., 19 birth cohorts; k=1., 30 survey years. u=periods, v=Cohorts
To ensure model stability, period effects (annual intervals) and cohort effects (5-year intervals) were modeled as random effects without smoothing, as the large sample size (n=665,254) mitigated overfitting risks. The CCREM addresses the age-period-cohort identification problem by modeling age as a fixed effect and period/cohort as random effects, following Yang and Land (2006) [14] The PCA_factor was derived from less influential variables (household size, home area, number of literate people, number of students, number of employed people) using Principal Component Analysis, retaining components explaining ≥70% of variance to reduce collinearity. The HAPC analysis was implemented using SAS software, version 9.4, PROC MIXED, with the restricted maximum-likelihood (REML) method.
In regression models, variables are sometimes squared to capture nonlinear relationships between the explanatory and dependent variables. For age, this approach allows modeling its effect at different ages, rather than assuming a linear effect across all ages.
Model 1, incorporating the variables mentioned, was estimated and analyzed using REML with the PROC MIXED procedure in SAS software, version 9.4. Charts were created using Microsoft Excel software, version 2016.
Results
The average household size over the 30-year study period was 4.27±1.98. The mean annual household income was 1,338,688,065 Rials (approximately $31,851 at the time of writing). The average age of the household head was 48.88±15.30 years, and the mean residential area was 86.97±51.67 m². Rural households accounted for 43.2% of the sample, and 10.3% of households were female-headed.
The average national HEI score over the 30 years was 48.39±10.25. Figure 2 shows the yearly trend in HEI scores, along with standard deviation bands.
The lowest and highest HEI scores were observed in 1995 and 2017, respectively. A declining trend was evident from 2018 onwards. Figure 1 presents raw data; model-based estimates are described in the next paragraphs.
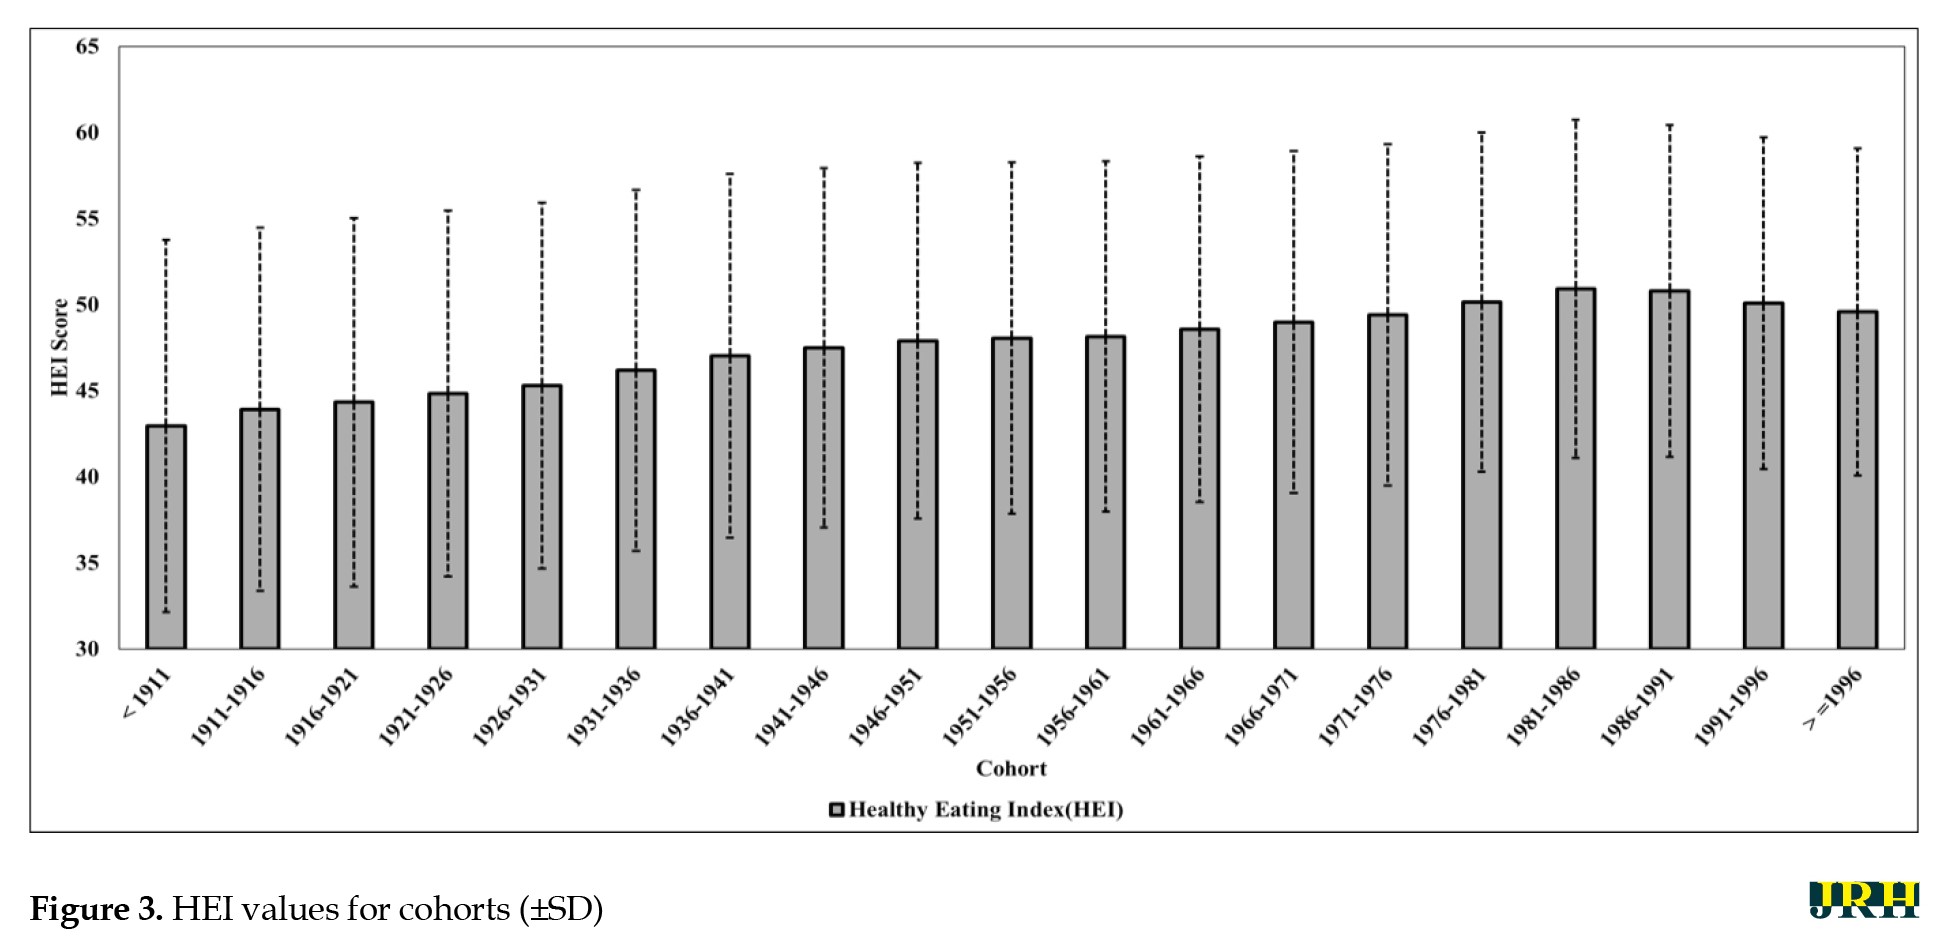
Figure 3 shows average HEI scores across five-year birth cohorts.
Figure 3 shows average HEI scores across five-year birth cohorts.
The lowest scores were observed in cohorts born before 1911, while the highest were among those born between 1981 and 1986. These unadjusted values were later used in the HAPC model to quantify cohort effects.
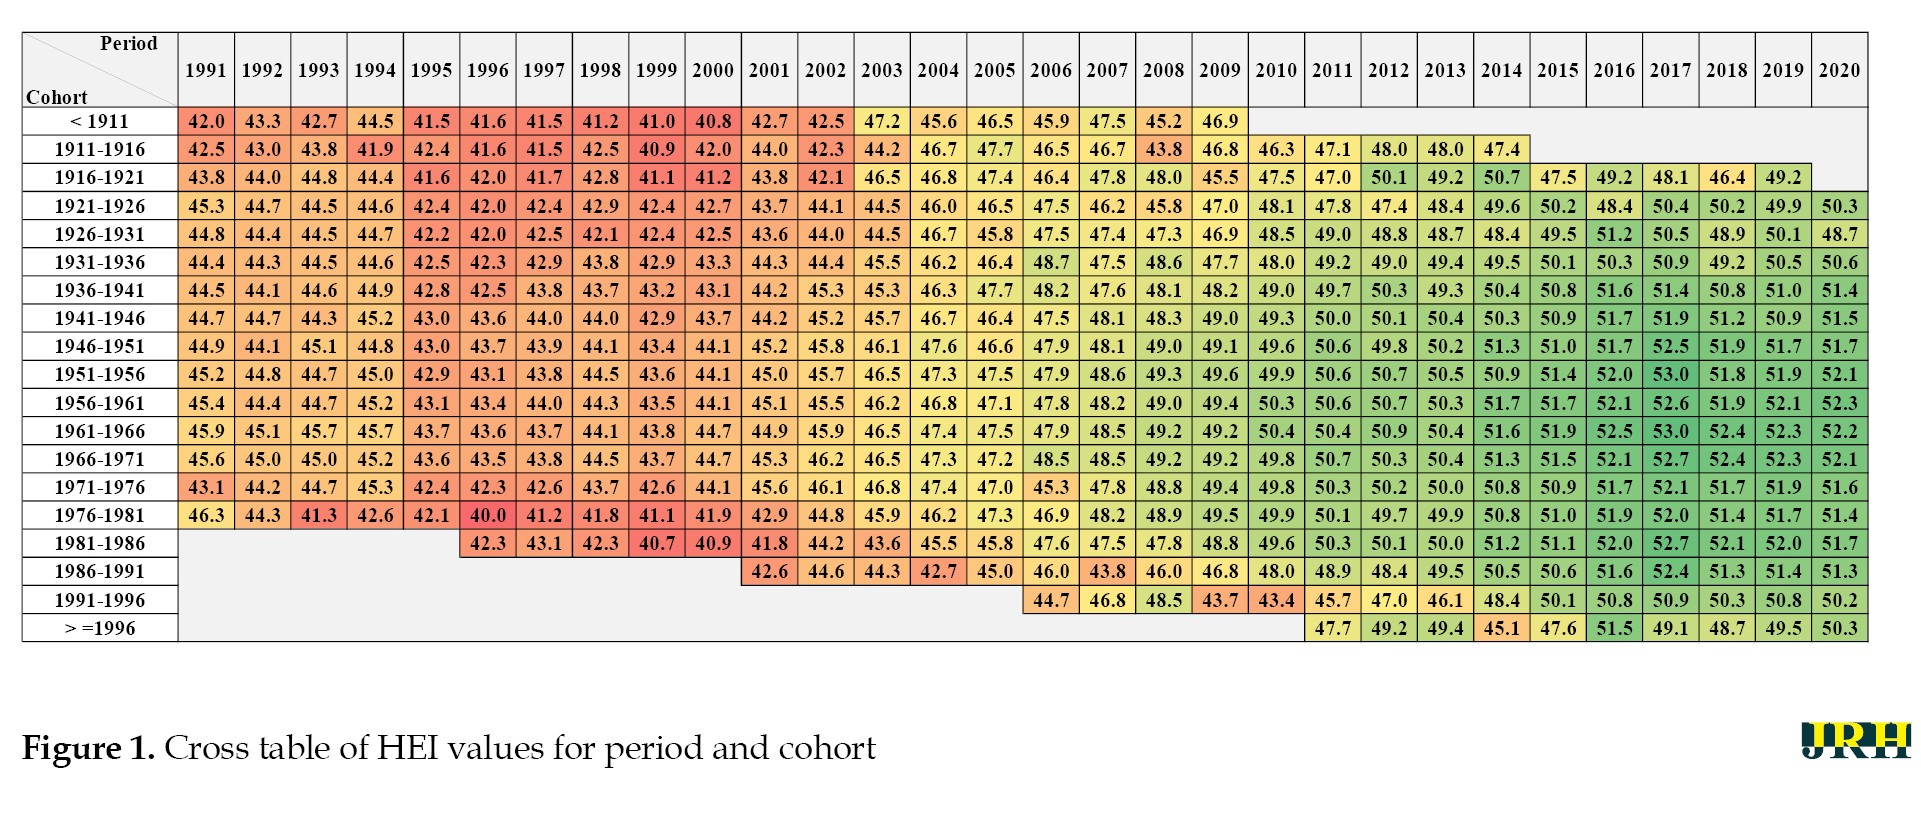
Figure 1 presents HEI scores across combinations of birth cohorts and survey years. The table reveals that HEI scores were generally low across all generations from 1991 to 2002, improved between 2010 and 2018, and declined again from 2019 onward, returning to levels similar to the early 1990s.
Table 1 summarizes the results of the HAPC models (Models 0 and 1), estimating the fixed and random effects on HEI.
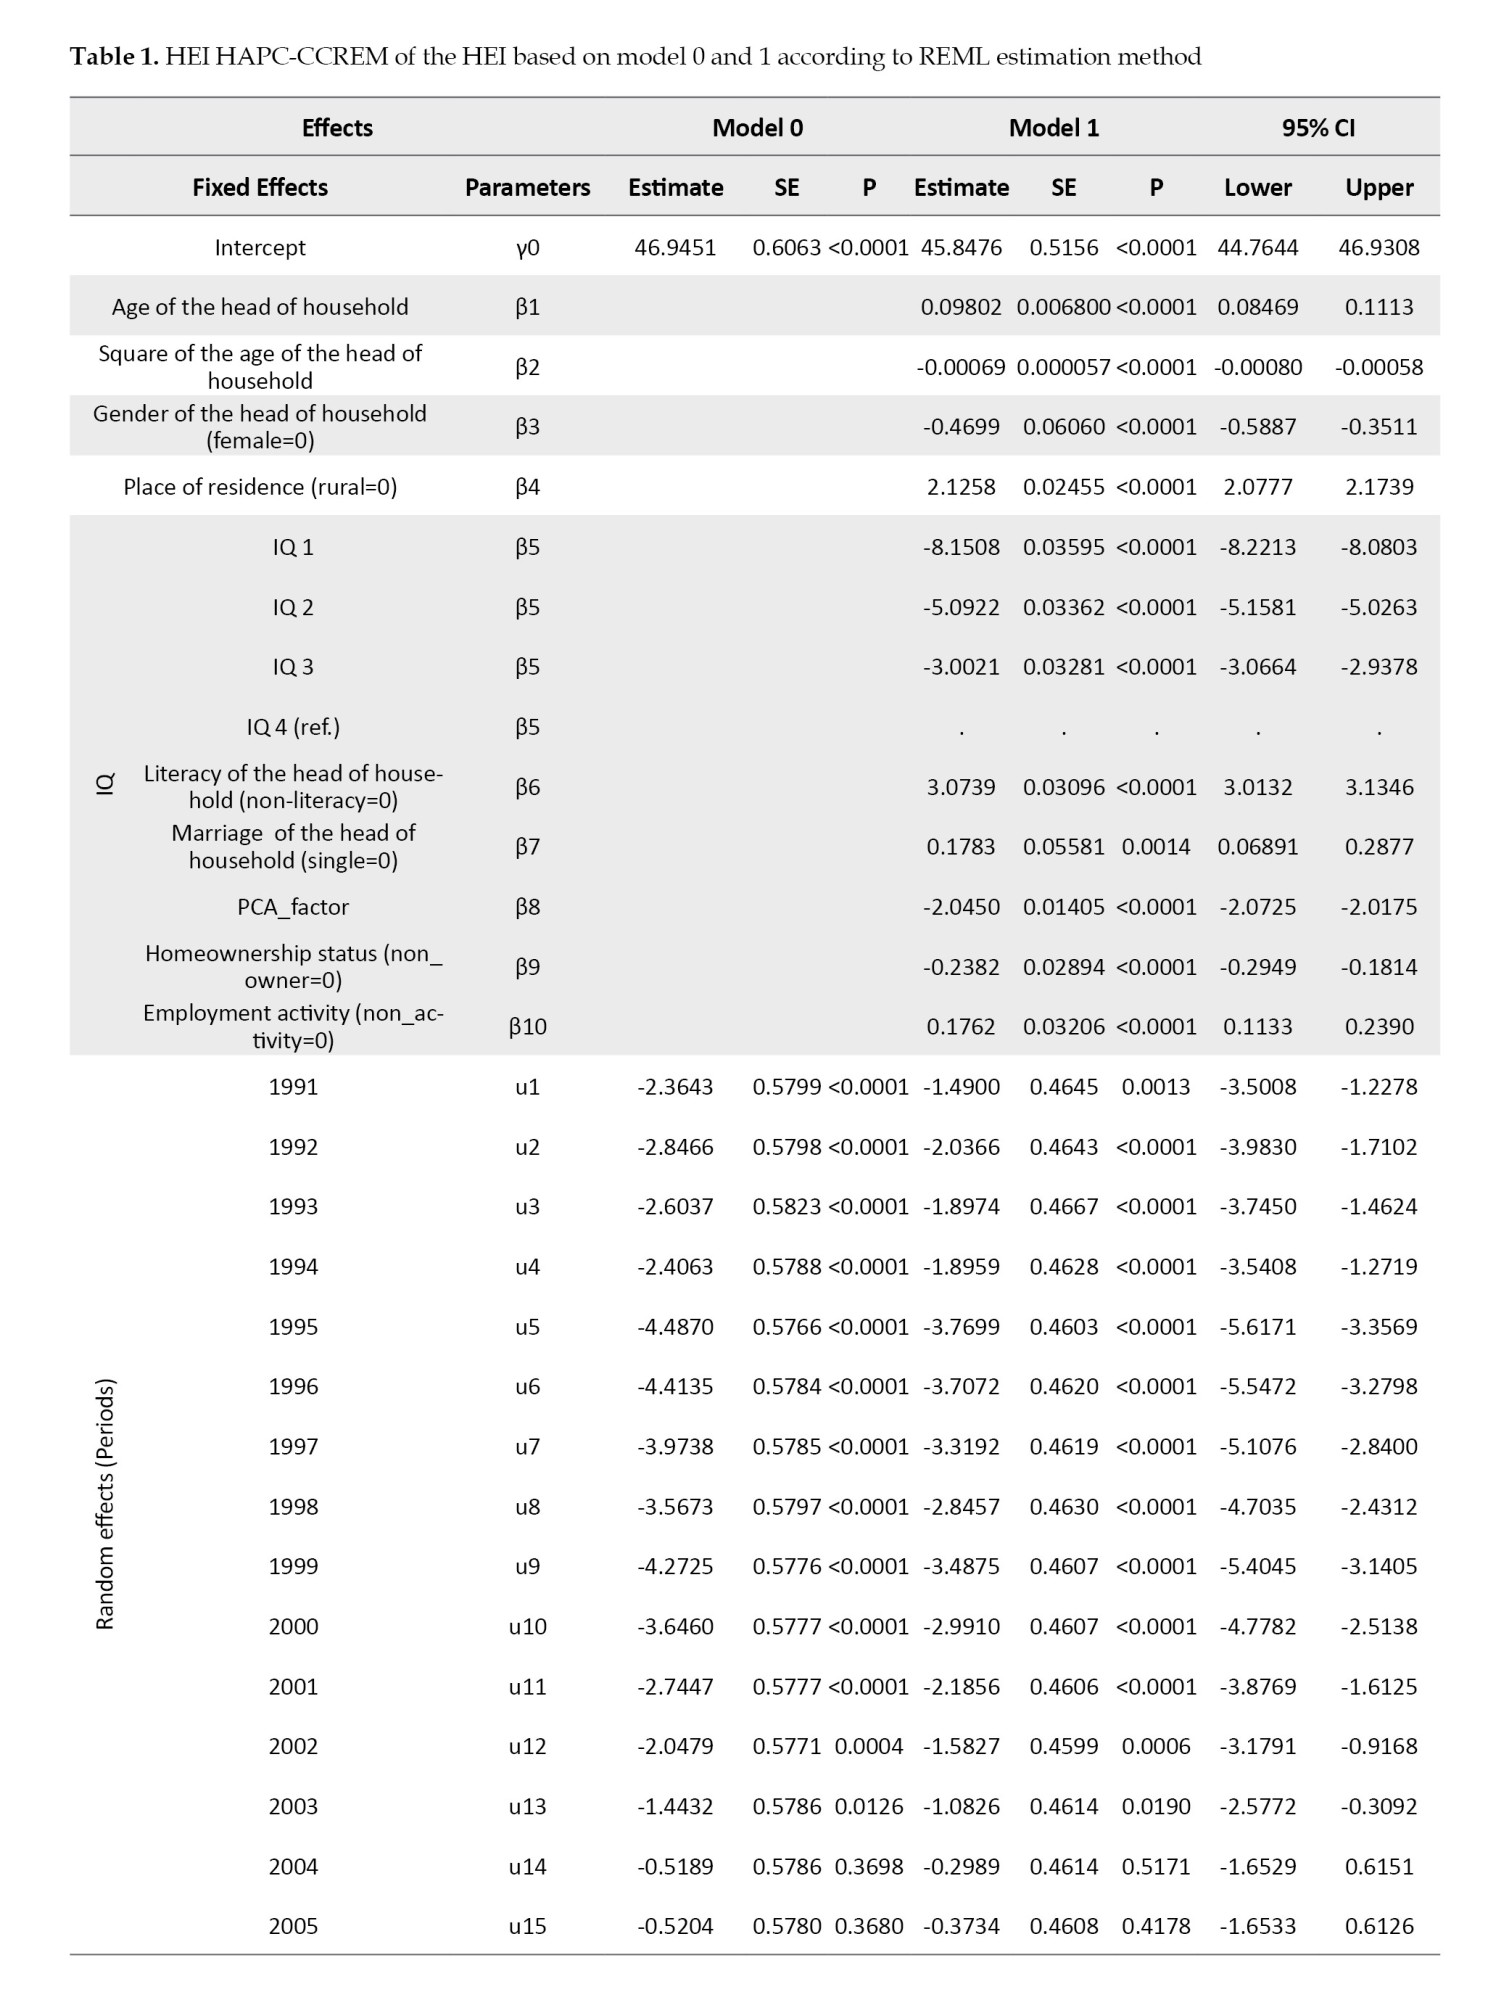
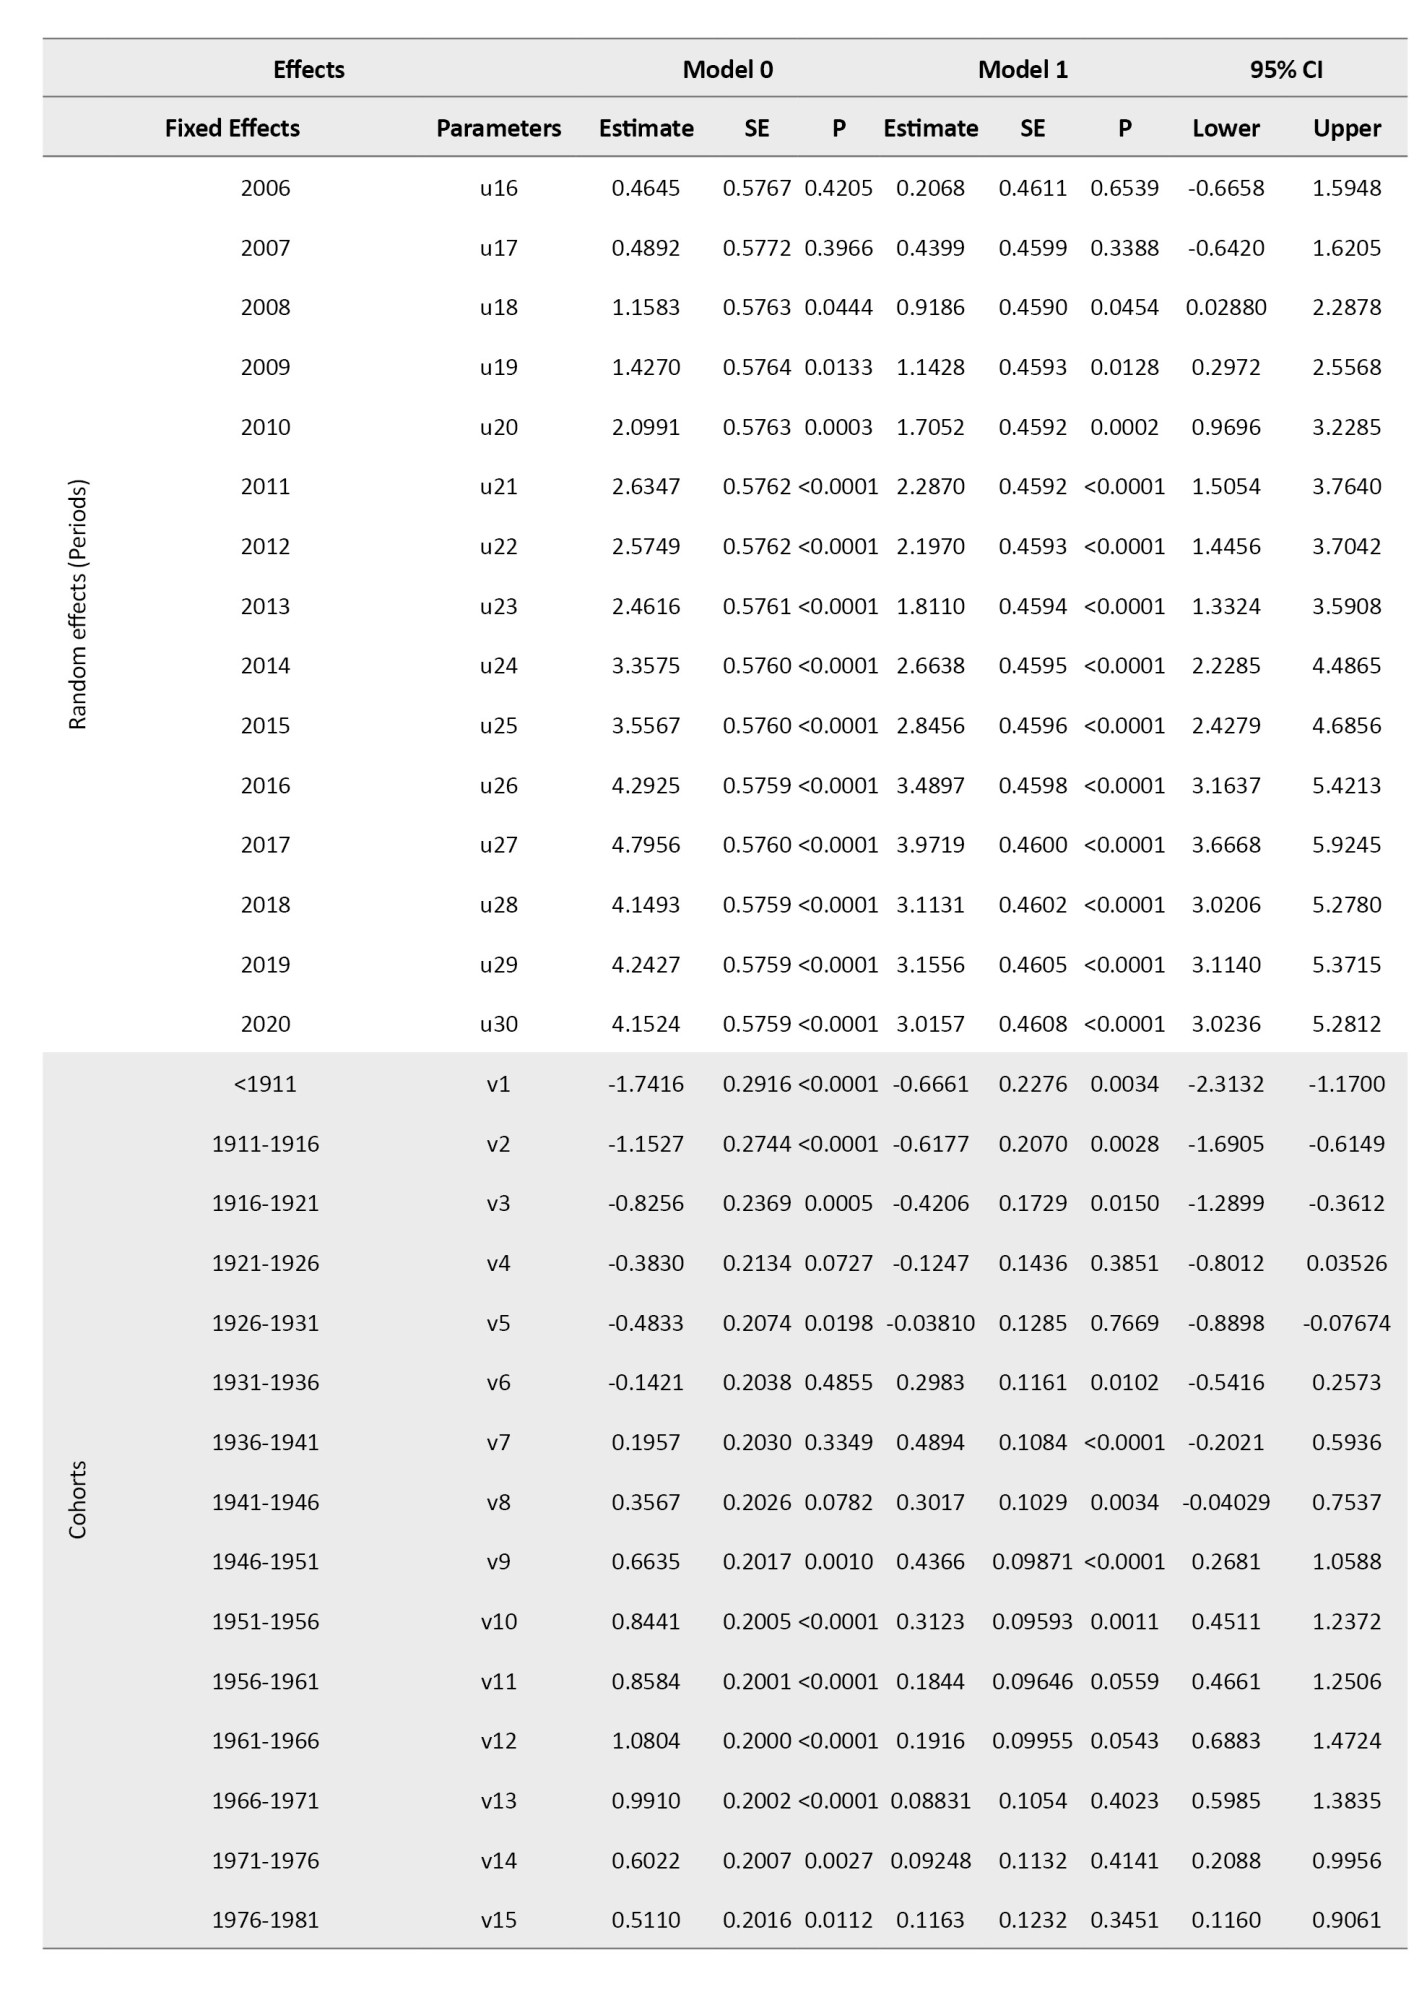
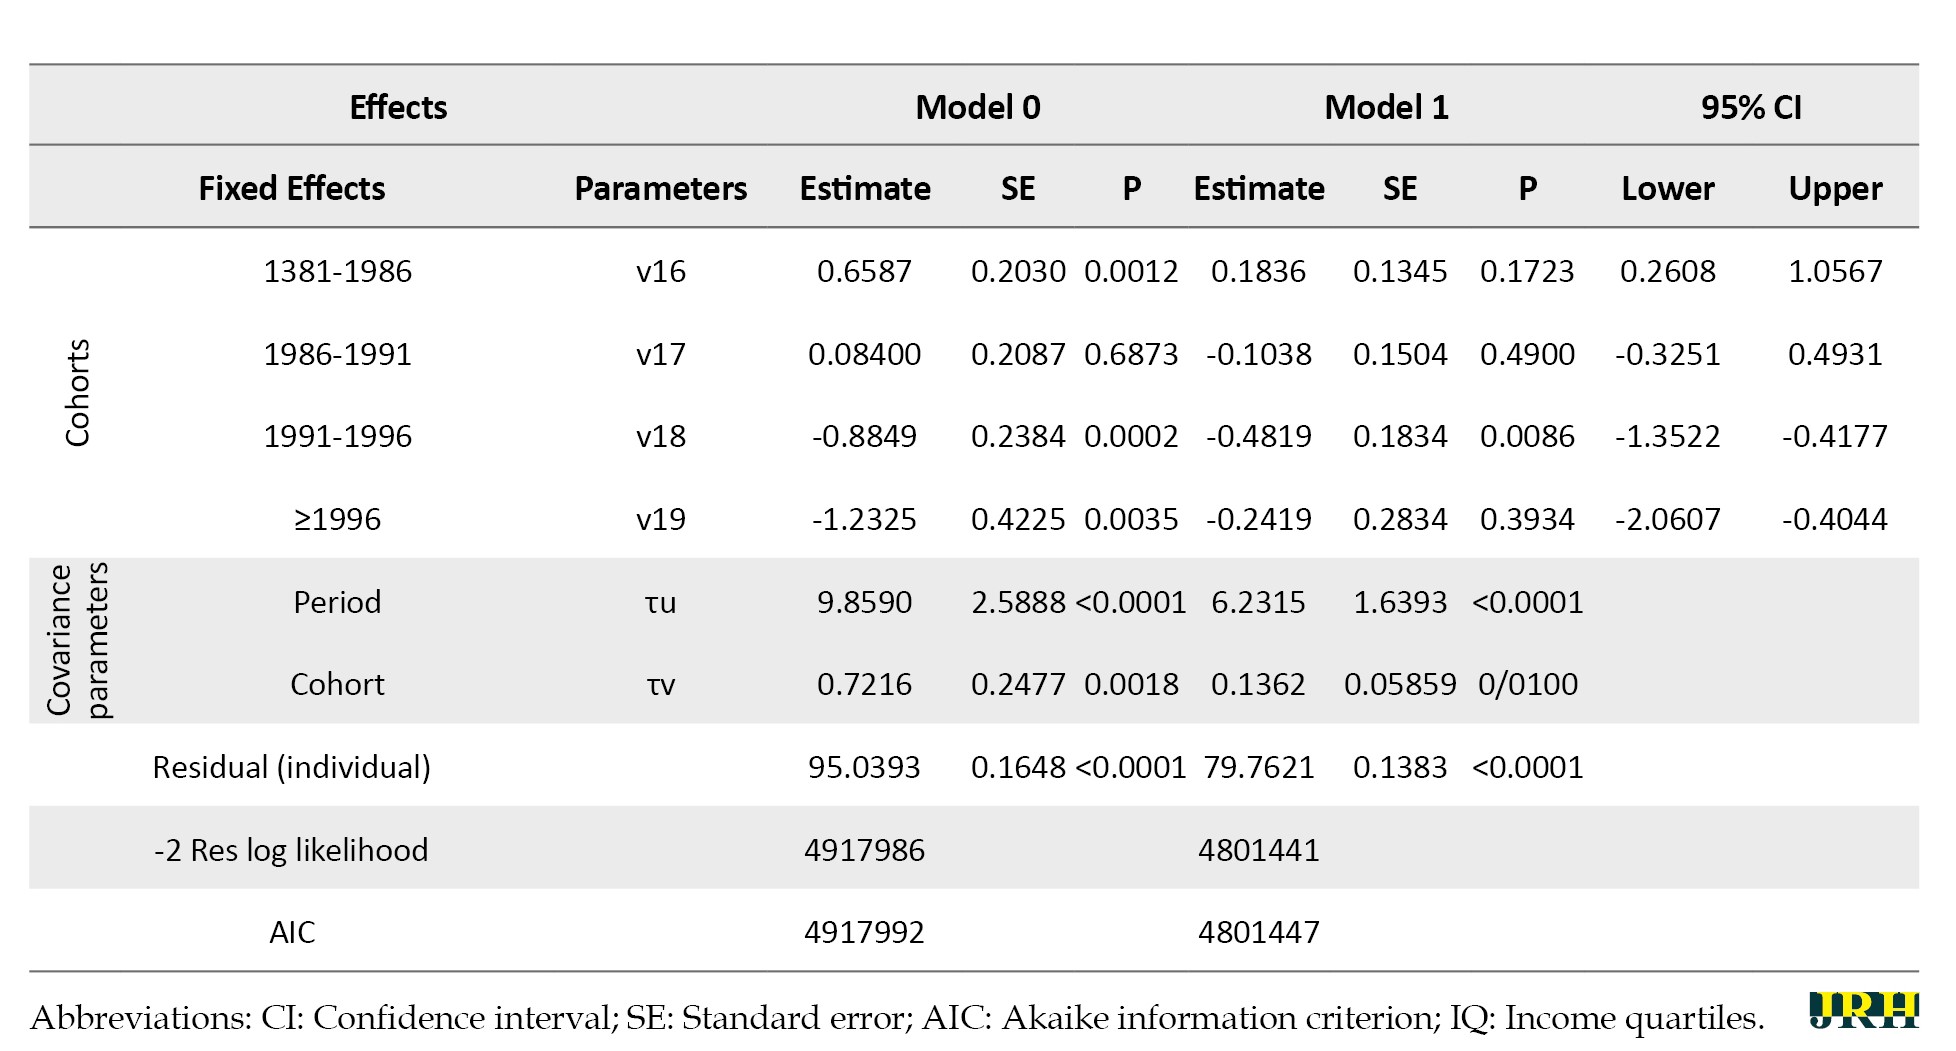
Model 1 shows that urban residence (β=2.12), higher income (IQ4), and education (β=3.07) were significantly associated with higher HEI scores. Married and employed household heads also had higher scores. Among age cohorts, those born between 1946 and 1961 had the most favorable dietary quality.
Model 0 reveals significant effects (P<0.01) for all periods except 2004-2007 (P >0.05). Additionally, age cohorts 1939-1936, 1936-1941, 1941-1946, and 1986-1991 do not exhibit significant changes (P>0.05), while the remaining age cohorts demonstrate significant variations (P<0.01).
Model 1, all periods except 2004-2007 exhibit significant effects (P<0.01). However, age cohorts 1921-1926, 1926-1931, 1966-1971, 1971-1976, 1976-1981, 1981-1986, 1986-1991, and ≥1996 do not show significant changes (P>0.05), while the remaining age cohorts demonstrate significant variations (P<0.01) and socioeconomic factors on HEI scores.
Discussion
This study utilized HIES data as a proxy for dietary consumption, a common approach in settings lacking direct dietary intake data [15, 23, 24]. The application of the HAPC model offers a novel approach to analyzing dietary quality trends in Iranian households over 30 years (1991–2020). Unlike traditional linear regression, the HAPC model disentangles age, period, and cohort effects, providing nuanced insights into dietary patterns and informing targeted interventions. This methodology, previously applied to non-communicable diseases [25-27], demonstrates its versatility in nutritional epidemiology [12].
Our study found a similar upward trend in HEI scores to that observed in the US National Health Study. Scores in our study increased from 43.86 (1999-2000) to 51.86 (2015-2016), showing a statistically significant positive trend. This represents an 8-point increase, compared to a 2-point increase in the US [28].
Nonetheless, our findings differ from a previous Iranian study (2001-2003) that reported a much lower average HEI (approximately 34) [23], probably due to a smaller sample size. Our larger and more recent data suggest an HEI closer to regional averages (approximately 45)[29]. This study examined dietary trends in Iranian households over 30 years (1991-2020). The HEI scores showed an initial rise from 1999 to 2017, indicating improvement in overall diet quality. However, this positive trend reversed after 2018, with HEI scores declining, suggesting a recent decline in dietary quality. The rise in HEI scores from 1999 to 2017 might be linked to public health initiatives promoting healthy eating and balanced diets. The observed decline in HEI scores after 2018 necessitates further investigation to identify contributing factors. This downward trend could be linked to international sanctions and economic shocks in Iran, which increased food prices and reduced access to nutritious imports. [2, 30].
Significant sociodemographic disparities were observed, with higher household income, education, and urban residence associated with better HEI scores, aligning with global evidence [23, 31]. Households with lower incomes and education levels may face barriers to accessing and affording nutritious foods, leading to poorer dietary choices [32].
Additionally, the study found that HEI scores were higher in urban areas than in rural areas. This finding aligns with previous research suggesting that urban residents may have better access to a wider variety of healthy food options and greater exposure to nutrition education programs [23, 29]. In contrast, rural areas may face challenges such as limited availability of fresh produce, longer distances to grocery stores, and fewer resources for nutrition education.
The HAPC model’s coefficients for residence, literacy, and income corroborate these findings, highlighting their impact on dietary quality [33]. The female head of household in our study had a positive effect, which is contrary to other studies [34]. The socioeconomic status of female heads of households seems to have been higher than that of males in the years after 2000 [23].
The study’s strengths include the large sample size of 665,254 households examined over 30 years, providing robust data for trend analysis and sociodemographic comparisons. Nevertheless, it is important to note that the study relied on self-reported data as a proxy of consumption, which may be subject to recall bias and social desirability.
Conclusion
This study sheds valuable light on dietary trends and sociodemographic factors influencing healthy eating habits in Iranian households. Utilizing 30 years of data and the HAPC model, this study reveals patterns in HEI scores. Although the initial rise in HEI scores from 1999 to 2017 is encouraging, the sharp decline observed after 2018 demands immediate attention and a deeper investigation into its causes. Potential factors such as shifts in food availability, economic constraints, or evolving social norms need to be identified. Understanding these drivers is vital for crafting targeted interventions to reverse this trend and promote long-term healthy dietary habits.
Limitations
Limitations include reliance on HIES as a proxy for consumption, which may introduce recall bias or underestimate actual intake, and the exclusion of 261,085 households due to outliers, potentially affecting generalizability. Although the HEI-2015 was adapted, it may not fully capture Iranian dietary nuances.
Ethical Considerations
Compliance with ethical guidelines
This study was approved by the Ethics Committee of Tehran University of Medical Sciences, Tehran, Iran (Code: IR.TUMS.MEDICINE.REC.1400.788). The data used in this study were obtained from the HIES conducted by the Statistical Center of Iran, as mentioned in the text. These data are available to researchers for free and without personal information.
Funding
This study is part of a doctoral thesis of Omid Emami, approved by Tehran University of Medical Sciences, Tehran, Iran.
Authors' contributions
Conceptualization, supervision and guarantors: Ahmadreza Dorosty Motlagh and Amirhossein Takian; Data collection, primary analysis, and manuscript drafting: Omid Emami; Methodology and HAPC analysis: Ehsan Mousa Farkhani; Manuscript review and approval: All authors.
Conflict of interest
The authors declared no conflicts of interest.
Acknowledgments
The authors extend special thanks to Zahra Esmaeli and the staff of the Statistical Center of Iran, Zeinab Farhadi Abdi, and Nayereh Esmaeilzadeh for their assistance in acquiring data and interpretation of findings.
Figure 1 presents HEI scores across combinations of birth cohorts and survey years. The table reveals that HEI scores were generally low across all generations from 1991 to 2002, improved between 2010 and 2018, and declined again from 2019 onward, returning to levels similar to the early 1990s.
Table 1 summarizes the results of the HAPC models (Models 0 and 1), estimating the fixed and random effects on HEI.
Model 1 shows that urban residence (β=2.12), higher income (IQ4), and education (β=3.07) were significantly associated with higher HEI scores. Married and employed household heads also had higher scores. Among age cohorts, those born between 1946 and 1961 had the most favorable dietary quality.
Model 0 reveals significant effects (P<0.01) for all periods except 2004-2007 (P >0.05). Additionally, age cohorts 1939-1936, 1936-1941, 1941-1946, and 1986-1991 do not exhibit significant changes (P>0.05), while the remaining age cohorts demonstrate significant variations (P<0.01).
Model 1, all periods except 2004-2007 exhibit significant effects (P<0.01). However, age cohorts 1921-1926, 1926-1931, 1966-1971, 1971-1976, 1976-1981, 1981-1986, 1986-1991, and ≥1996 do not show significant changes (P>0.05), while the remaining age cohorts demonstrate significant variations (P<0.01) and socioeconomic factors on HEI scores.
Discussion
This study utilized HIES data as a proxy for dietary consumption, a common approach in settings lacking direct dietary intake data [15, 23, 24]. The application of the HAPC model offers a novel approach to analyzing dietary quality trends in Iranian households over 30 years (1991–2020). Unlike traditional linear regression, the HAPC model disentangles age, period, and cohort effects, providing nuanced insights into dietary patterns and informing targeted interventions. This methodology, previously applied to non-communicable diseases [25-27], demonstrates its versatility in nutritional epidemiology [12].
Our study found a similar upward trend in HEI scores to that observed in the US National Health Study. Scores in our study increased from 43.86 (1999-2000) to 51.86 (2015-2016), showing a statistically significant positive trend. This represents an 8-point increase, compared to a 2-point increase in the US [28].
Nonetheless, our findings differ from a previous Iranian study (2001-2003) that reported a much lower average HEI (approximately 34) [23], probably due to a smaller sample size. Our larger and more recent data suggest an HEI closer to regional averages (approximately 45)[29]. This study examined dietary trends in Iranian households over 30 years (1991-2020). The HEI scores showed an initial rise from 1999 to 2017, indicating improvement in overall diet quality. However, this positive trend reversed after 2018, with HEI scores declining, suggesting a recent decline in dietary quality. The rise in HEI scores from 1999 to 2017 might be linked to public health initiatives promoting healthy eating and balanced diets. The observed decline in HEI scores after 2018 necessitates further investigation to identify contributing factors. This downward trend could be linked to international sanctions and economic shocks in Iran, which increased food prices and reduced access to nutritious imports. [2, 30].
Significant sociodemographic disparities were observed, with higher household income, education, and urban residence associated with better HEI scores, aligning with global evidence [23, 31]. Households with lower incomes and education levels may face barriers to accessing and affording nutritious foods, leading to poorer dietary choices [32].
Additionally, the study found that HEI scores were higher in urban areas than in rural areas. This finding aligns with previous research suggesting that urban residents may have better access to a wider variety of healthy food options and greater exposure to nutrition education programs [23, 29]. In contrast, rural areas may face challenges such as limited availability of fresh produce, longer distances to grocery stores, and fewer resources for nutrition education.
The HAPC model’s coefficients for residence, literacy, and income corroborate these findings, highlighting their impact on dietary quality [33]. The female head of household in our study had a positive effect, which is contrary to other studies [34]. The socioeconomic status of female heads of households seems to have been higher than that of males in the years after 2000 [23].
The study’s strengths include the large sample size of 665,254 households examined over 30 years, providing robust data for trend analysis and sociodemographic comparisons. Nevertheless, it is important to note that the study relied on self-reported data as a proxy of consumption, which may be subject to recall bias and social desirability.
Conclusion
This study sheds valuable light on dietary trends and sociodemographic factors influencing healthy eating habits in Iranian households. Utilizing 30 years of data and the HAPC model, this study reveals patterns in HEI scores. Although the initial rise in HEI scores from 1999 to 2017 is encouraging, the sharp decline observed after 2018 demands immediate attention and a deeper investigation into its causes. Potential factors such as shifts in food availability, economic constraints, or evolving social norms need to be identified. Understanding these drivers is vital for crafting targeted interventions to reverse this trend and promote long-term healthy dietary habits.
Limitations
Limitations include reliance on HIES as a proxy for consumption, which may introduce recall bias or underestimate actual intake, and the exclusion of 261,085 households due to outliers, potentially affecting generalizability. Although the HEI-2015 was adapted, it may not fully capture Iranian dietary nuances.
Ethical Considerations
Compliance with ethical guidelines
This study was approved by the Ethics Committee of Tehran University of Medical Sciences, Tehran, Iran (Code: IR.TUMS.MEDICINE.REC.1400.788). The data used in this study were obtained from the HIES conducted by the Statistical Center of Iran, as mentioned in the text. These data are available to researchers for free and without personal information.
Funding
This study is part of a doctoral thesis of Omid Emami, approved by Tehran University of Medical Sciences, Tehran, Iran.
Authors' contributions
Conceptualization, supervision and guarantors: Ahmadreza Dorosty Motlagh and Amirhossein Takian; Data collection, primary analysis, and manuscript drafting: Omid Emami; Methodology and HAPC analysis: Ehsan Mousa Farkhani; Manuscript review and approval: All authors.
Conflict of interest
The authors declared no conflicts of interest.
Acknowledgments
The authors extend special thanks to Zahra Esmaeli and the staff of the Statistical Center of Iran, Zeinab Farhadi Abdi, and Nayereh Esmaeilzadeh for their assistance in acquiring data and interpretation of findings.
References
- Krebs-Smith SM, Pannucci TE, Subar AF, Kirkpatrick SI, Lerman JL, Tooze JA, et al. Update of the healthy eating index: HEI-2015. Journal of the Academy of Nutrition and Dietetics. 2018; 118(9):1591-602. [DOI:10.1016/j.jand.2018.05.021] [PMID] [PMCID]
- Layani G, Bakhshoodeh M, Aghabeygi M, Kurstal Y, Viaggi D. The impact of food price shocks on poverty and vulnerability of urban households in Iran. Bio-based and Applied Economics. 2020; 9(1):109-25. [DOI:10.13128/bae-8892]
- Shams-White MM, Pannucci TE, Lerman JL, Herrick KA, Zimmer M, Meyers Mathieu K, et al. Healthy eating index-2020: review and update process to reflect the dietary guidelines for Americans, 2020-2025. Journal of the Academy of Nutrition and Dietetics. 2023; 123(9):1280-8. [DOI:10.1016/j.jand.2023.05.015] [PMID] [PMCID]
- Kirkpatrick SI, Reedy J, Krebs-Smith SM, Pannucci TE, Subar AF, Wilson MM, et al. Applications of the Healthy Eating Index for surveillance, epidemiology, and intervention research: Considerations and caveats. Journal of the Academy of Nutrition and Dietetics. 2018; 118(9):1603-21. [DOI:10.1016/j.jand.2018.05.020] [PMID] [PMCID]
- Morze J, Danielewicz A, Hoffmann G, Schwingshackl L. Diet quality as assessed by the healthy eating index, alternate healthy eating index, dietary approaches to stop hypertension score, and health outcomes: A second update of a systematic review and meta-analysis of cohort studies. Journal of the Academy of Nutrition and Dietetics. 2020; 120(12):1998-2031. e15. [DOI:10.1016/j.jand.2020.08.076] [PMID]
- den Braver NR, Rutters F, van der Spek ALJK, Ibi D, Looman M, Geelen A, et al. Adherence to a food group-based dietary guideline and incidence of prediabetes and type 2 diabetes. European Journal of Nutrition. 2020; 59(5):2159-69. [DOI:10.1007/s00394-019-02064-8] [PMID] [PMCID]
- Kebbe M, Gao M, Perez-Cornago A, Jebb SA, Piernas C. Adherence to international dietary recommendations in association with all-cause mortality and fatal and non-fatal cardiovascular disease risk: A prospective analysis of UK Biobank participants. BMC Medicine. 2021; 19(1):134. [DOI:10.1186/s12916-021-02011-7] [PMID] [PMCID]
- Bell A, Jones K. The Hierarchical Age-Period-Cohort model: Why does it find the results that it finds? Quality and Quantity. 2018; 52(2):783-99. [DOI:10.1007/s11135-017-0488-5] [PMID] [PMCID]
- Hu Y, Willett WC, Manson JAE, Rosner B, Hu FB, Sun Q. Intake of whole grain foods and risk of coronary heart disease in US men and women. BMC medicine. 2022; 20(1):192. [DOI:10.1186/s12916-022-02396-z] [PMID] [PMCID]
- Wang F, Ugai T, Haruki K, Wan Y, Akimoto N, Arima K, et al. Healthy and unhealthy plant‐based diets in relation to the incidence of colorectal cancer overall and by molecular subtypes. Clinical and Translational Medicine. 2022; 12(8):e893. [DOI:10.1002/ctm2.893] [PMID] [PMCID]
- Willett W. Nutritional epidemiology. 3th ed. Oxford: Oxford University Press; 2012. [DOI:10.1093/acprof:oso/9780199754038.001.0001]
- Sobhani SR, Eini-Zinab H, Rezazadeh A. Socioeconomic status and changes in iranian household food basket using national household budget and expenditure survey data, 1991-2017. Iran J Public Health. 2022; 51(4):919-28. [DOI:10.18502/ijph.v51i4.9254] [PMID]
- Mottaleb KA, Rahut DB, Kruseman G, Erenstein O. Evolving food consumption patterns of rural and urban households in developing countries: A Bangladesh case. British Food Journal. 2018; 120(2):392-408. [DOI:10.1108/BFJ-12-2016-0620]
- Yang Y, Land KC. Age-period-cohort analysis: New models, methods, and empirical applications. New York: Taylor & Francis; 2013. [Link]
- Bermudez OI, Lividini K, Smitz MF, Fiedler JL. Estimating micronutrient intakes from Household Consumption and Expenditures Surveys (HCES): an example from Bangladesh. Food and Nutrition Bulletin. 2012; 33(3 S):S208-13. [DOI:10.1177/15648265120333S209] [PMID]
- Coates J, Rogers BL, Blau A, Lauer J, Roba A. Filling a dietary data gap? Validation of the adult male equivalent method of estimating individual nutrient intakes from household-level data in Ethiopia and Bangladesh. Food Policy. 2017; 72:27-42. [DOI:10.1016/j.foodpol.2017.08.010]
- Weisell R, Dop MC. The adult male equivalent concept and its application to Household Consumption and Expenditures Surveys (HCES). Food and nutrition bulletin. 2012; 33(3 S):S157-62. [DOI:10.1177/15648265120333S203] [PMID]
- UNU, WHO, FAO. Human energy requirements: Report of a joint FAO/WHO/UNU expert consultation: Rome, 17-24 October 2001. Rome: Food and Agriculture Organization; 2004. [Link]
- Pecot RK, Watt BK. Food yields-summarized by different stages of preparation. Maryland: Agricultural Research Service; 1975. [Link]
- Ghafarpour M, Hoshiar-rad A, Kianfar H. [The Manual for household measures, cooking yields factors and edible portion of food (Persian)]. Tehran: Agricultural Science Publication; 1999. [Link]
- Gustafsson J, Cederberg C, Sonesson U, Emanuelsson A. The methodology of the FAO study: Global Food Losses and Food Waste-extent, causes and prevention”-FAO, 2011. Gothenburg: SIK Institutet för livsmedel och bioteknik; 2013. [Link]
- Waid JL, Bogard JR, Thilsted SH, Gabrysch S. Estimates of average energy requirements in Bangladesh: Adult Male Equivalent values for use in analyzing household consumption and expenditure surveys. Data in brief. 2017; 14:101-6. [DOI:10.1016/j.dib.2017.07.022] [PMID] [PMCID]
- Ebrahimi S, McNaughton SA, Leech RM, Abdollahi M, Houshiarrad A, Livingstone KM. A comparison of diet quality indices in a nationally representative cross-sectional study of Iranian households. Nutrition Journal. 2020; 19(1):132. [DOI:10.1186/s12937-020-00646-5] [PMID] [PMCID]
- Tang K, Adams KP, Ferguson EL, Woldt M, Yourkavitch J, Pedersen S, et al. Systematic review of metrics used to characterize dietary nutrient supply from household consumption and expenditure surveys. Public Health Nutrition. 2022; 25(5):1153-65. [DOI:10.1017/S1368980022000118] [PMID] [PMCID]
- Sahebi R, Motevalian SA, Sahebi L, Sharifi H. [The intrinsic estimator method for control of age, period, cohort, and its comparison with the descriptive classic model (Persian)]. Iranian Journal of Epidemiology. 2017; 13(2):90-7. [Link]
- Murphy CC, Yang YC. Use of age-period-cohort analysis in cancer epidemiology research. Current Epidemiology Reports. 2018; 5(4):418-31. [DOI:10.1007/s40471-018-0174-8] [PMID] [PMCID]
- Su Z, Zou Z, Hay SI, Liu Y, Li S, Chen H, et al. Global, regional, and national time trends in mortality for congenital heart disease, 1990-2019: An age-period-cohort analysis for the Global Burden of Disease 2019 study. EClinicalMedicine. 2022; 43:101249. [DOI:10.1016/j.eclinm.2021.101249] [PMID] [PMCID]
- Shan Z, Rehm CD, Rogers G, Ruan M, Wang DD, Hu FB, et al. Trends in dietary carbohydrate, protein, and fat intake and diet quality among US adults, 1999-2016. Jama. 2019; 322(12):1178-87. [DOI:10.1001/jama.2019.13771] [PMID] [PMCID]
- Miller V, Webb P, Cudhea F, Shi P, Zhang J, Reedy J, et al. Global dietary quality in 185 countries from 1990 to 2018 show wide differences by nation, age, education, and urbanicity. Nature Food. 2022; 3(9):694-702. [DOI:10.1038/s41586-022-05416-3] [PMID] [PMCID]
- Kiani MM, Mostafavi H, Ebrahimi F, Majdzadeh R, Mohamadi E, Kraemer A, et al. The experiences and perceptions of people with chronic and rare diseases during political-economic sanctions in Iran: A qualitative study. BMC Health Services Research. 2024; 24(1):276. [DOI:10.1186/s12913-024-10786-7] [PMID] [PMCID]
- Darmon N, Drewnowski A. Does social class predict diet quality? The American Journal of Clinical Nutrition. 2008; 87(5):1107-17. [DOI:10.1093/ajcn/87.5.1107] [PMID]
- McInerney M, Csizmadi I, Friedenreich CM, Uribe FA, Nettel-Aguirre A, McLaren L, et al. Associations between the neighbourhood food environment, neighbourhood socioeconomic status, and diet quality: An observational study. BMC public health. 2016; 16:984. [DOI:10.1186/s12889-016-3631-7] [PMID] [PMCID]
- Amerzadeh M, Takian A, Pouraram H, Akbari Sari A, Ostovar A. A policy package for socio-cultural factors of promoting healthy diet in Iran. Journal of Diabetes & Metabolic Disorders. 2024; 23(2):1959-65. [DOI:10.1007/s40200-024-01449-9] [PMID] [PMCID]
- López-Olmedo N, Popkin BM, Taillie LS. Association between socioeconomic status and diet quality in Mexican men and women: A cross-sectional study. PloS one. 2019; 14(10):e0224385. [DOI:10.1371/journal.pone.0224385] [PMID] [PMCID]
Type of Study: Orginal Article |
Subject:
● Health Systems
Received: 2025/05/20 | Accepted: 2025/11/17 | Published: 2026/07/1
Received: 2025/05/20 | Accepted: 2025/11/17 | Published: 2026/07/1
| Rights and permissions | |
 |
This work is licensed under a Creative Commons Attribution-NonCommercial 4.0 International License. |


This is an open access article distributed under the terms of the Creative Commons Attribution License (CC-By-NC), which permits use, distribution, and reproduction in any medium, provided the original work is properly cited and is not used for commercial purposes.
Contact Information
