

Volume 15, Issue 6 And S7 (Artificial Intelligence 2025)
J Research Health 2025, 15(6 And S7): 723-744 |
Back to browse issues page


Download citation:
BibTeX | RIS | EndNote | Medlars | ProCite | Reference Manager | RefWorks
Send citation to:


BibTeX | RIS | EndNote | Medlars | ProCite | Reference Manager | RefWorks
Send citation to:
Chellapandi A, Rengaraj A, Kaliannan S. Analyzing the Model Performances of Dot Hemorrhage Pattern Recognition Using Deep Neural Networks. J Research Health 2025; 15 (6) :723-744
URL: http://jrh.gmu.ac.ir/article-1-2889-en.html
URL: http://jrh.gmu.ac.ir/article-1-2889-en.html


1- Department of Electronics and Communication Engineering, SRM Institute of Science and Technology Ramapuram Campus, Tamilnadu, India.
2- Department of Electronics and Communication Engineering, SRM Institute of Science and Technology Ramapuram Campus, Tamilnadu, India. ,arthir2@srmist.edu.in
2- Department of Electronics and Communication Engineering, SRM Institute of Science and Technology Ramapuram Campus, Tamilnadu, India. ,
Keywords: Dot hemorrhages (DH), Convolutional neural networks (CNN), Deep learning (DL), Machine learning (ML), Contrast limited adaptive histogram equalization (CLAHE)
Full-Text [PDF 4303 kb]
(182 Downloads)
| Abstract (HTML) (1834 Views)
Full-Text: (116 Views)
Introduction
Diabetes is a prevalent and serious chronic disease with long-term consequences. It occurs when blood sugar or glucose levels become too high. Insulin is a hormone that transports blood glucose into bodily cells. Diabetes occurs when the pancreas fails to produce enough insulin or the body cannot use it properly. Excess hyperglycemia in the bloodstream can harm several physiological systems. Diabetes can cause both macrovascular (big blood vessels) and microvascular (small blood vessels) complications, including retinopathy, nephropathy, neuropathy, heart attacks, strokes, and inadequate blood supply to the legs. Diabetic retinopathy (DR) is the abnormal development of blood vessels in the retina caused by diabetes, leading to vitreous hemorrhages. DR can cause deformities, such as microaneurysms, hemorrhages, and hard and soft exudates (cotton wool patches). The global diabetes overview for 2023 indicates a diabetic population of 537 million International Diabetes Federation (IDF), with a predicted increase to 783 million by 2045. Additionally, there are annual deaths of 1.5 million World Health Organization (WHO).
The main objective of this work was to develop an automated approach for DR detection. We aimed at developing a deep learning (DL) approach for correctly detecting and classifying DR existence and severity levels. DR affects one-third of all diabetic people. An accurate diagnosis at an early stage can lessen the risk of vision loss. The current approaches are effective but require substantial resources. Advancements in AI assist in the diagnostic process by enabling automated image analysis to help specialists detect early indicators of DR. All individuals with diabetes should have their eyes checked at least once a year. The proposed research aims to investigate changes in the ocular vascular system as diabetes progresses, utilizing computational vision, machine learning (ML), convolutional neural networks (CNN), and other DL approaches to screen for detection and classification of DR. When used in clinical diagnostic settings, this technology can save time and provide accurate results more efficiently, benefiting both patients and medical practitioners.
Literature survey
For DR classification, an ANN classifier employing Bayesian regularization and resilient backpropagation techniques yields the best results in terms of sensitivity and precision [1]. CNN is used for feature extraction, selection, and classification. The automatic screening method created by Gharaibeh et al. yielded a 98.4% accuracy rate in DR classification following a series of earlier processing techniques. Entropy images are created from retinal images in order to improve categorization. The intricacy of the original fundus images can be determined by quantifying the image information. Using DL for categorization increases accuracy from 81.8% to 86.0% when standard fundus images are employed [2].
Automatic DR identification using CNN, ResNet50, and InceptionV3 achieved a noteworthy 96.18% accuracy over 80 epochs [3]. For DR classification, VGG-19, a visual geometry group network (VGG Net), employs preprocessing tasks. This classification technique segments regions using a Gaussian mixture and selects features using singular value decomposition. With a 98.34% accuracy in DL-based segmentation, feature extraction, feature selection, and classification, the proposed model is reported to produce superior outcomes [4]. In a different experiment, Zhang et al. used ensemble learning and transfer learning in the DL model to categorize DR images. Following pre-processing techniques, like image normalization and histogram equalization, data augmentation is used. The model achieved an average accuracy of 96.50% [5]. Shanthi et al. used an AlexNet CNN as a pre-processing technique for classification of DR in fundus imaged based on green channel extraction [6].
The Synergic DL approach proposed by Kathiresan et al. produced accurate classifications of DR in fundus images. When preprocessing and segmentation are performed prior to classification, the DL model outperforms many other models currently in use [7]. Gayathri et al. identified DR using multiple ML classifiers and achieved remarkably good results after using CNN to extract the features from a unique study. In this experiment, the CNN proves to be an excellent classifier when multiple classifiers are integrated [8]. In a different experiment, a multi-scale shallow CNN is merged. Each CNN acts as a fundamental learner, facilitating feature extraction from various vision-related perceptual domains, and the integration of the networks is used to establish the final classification. It is evident that this integrated approach performs better than other state-of-the-art models. When additional image enhancement techniques, like unsharp masking (UM) and histogram equalization are applied, the model performs better [9]. In the study by Pao et al. UM is used to evaluate the fundus image preprocessing and the Gray level fundus image entropy. Using both image types for categorization in a bi-channel CNN yields better results [10]. In order to classify an image, it must be selected from a predefined set of categories, for which numerous techniques have been developed.
ML is a technology that is frequently used in many different fields. ML techniques are applied to fundus images in order to classify DR. A three-stage classification technique is used to distinguish between DR and non-DR images. AdaBoost, K-nearest neighbor (KNN), SVM, and gaussian mixture model (GMM) are ML approaches that manage the three steps of DR processing: Segmentation, lesion categorization, and severity rating. KNN and GMM have been found to perform well in classification [11]. By classifying DR using the Messidor and DBret datasets, SVM and KNN are used to identify retinal microaneurysms, with SVM performing better than KNN [12]. In terms of DR prediction, SVM outperforms decision trees and logistic regression [13]. After pre-processing and segmentation, SVM is used to classify DR into three classes: Normal, mild, and severe [14]. The Naive Bayes classifier outperforms SVM in a comparison of two ML techniques for classifying DR instances [15]. The author proposed how deep learning models can enhance diagnostic accuracy by automatically identifying relevant features in medical imaging data. Compared with various CNN models, VGG-16 outperforms others in detecting the presence of stroke types with higher accuracy [16]. For image classification, three models, like SVM, KNN, and XGBoost are used and SVM outperforms the other two [17]. DR is detected in retinal images using multilayer perceptron neural networks [18]. Optimal path forest (OPF) and restricted boltzmann machines (RBM) models were used to classify retinal images according to the presence or absence of disease-related retinopathy.
For the binary and multiclass categorization of DR, Gayathri et al. proposed an automated methodology [19]. The anisotropic dual-tree complex wavelet transform (ADTCWT) was used to extract features from retinal fundus images. Mujeeb Rahman et al. demonstrated an automated DR screening method utilizing ML techniques [20]. In medical image classification tasks, deep learning models, particularly CNNs, have shown impressive accuracy. Diagnostic performance is further improved by transfer learning with pre-trained architectures, such as VGG and ResNet. In order to improve model generalization, recent developments further highlight the significance of pre-processing methods and data augmentation [21]. The two methods that were employed were DNN and SVM. The three primary procedures that were emphasized in the study were image segmentation, feature extraction, and classification. The combined ML architecture developed by Narayanan et al. aims to diagnose and grade DR. [22]. This effort proposes a theoretical framework to assist doctors in diagnosing patients with brain strokes, utilizing image segmentation to identify brain strokes [23]. The author proposed that artificial intelligence and image processing can be used to detect and classify early-stage DR, allowing for prompt diagnosis by identifying minute retinal anomalies. This method enables effective screening in clinical settings, improves accuracy, and lowers manual errors [24]. Using vascular characteristics as important biomarkers for disease detection, this study proposes a DL pipeline for categorizing retinal vessels to aid in the early prediction of DR and retinal pigmentosa [25]. In order to improve the early detection of retinal dot hemorrhages (DH) and increase the sensitivity and accuracy of detecting the early stages of retinal illness, this study investigated a novel dynamic image comparison technique [26]. The strategy was able to compete with the most advanced deep learning and handmade techniques. Evaluation on the Kaggle APTOS and DIARETDB1 datasets revealed excellent performance, with DIARETDB1 obtaining up to 97% accuracy [27].
The research titled “DR: New concepts of screening, monitoring, and interventions” (2024) [28] highlights both biological insights and technological innovations in screening, monitoring, and treatment. This study on early oxidative, inflammatory, and neurovascular changes in the retina and brain, even during prediabetes, demonstrated that conventional fundus examinations only detect DR at advanced stages. In contrast, advanced imaging modalities such as OCT, OCTA, MSI, and ZNDpA staining, along with functional testing, can reveal earlier pathologies, enabling timely interventions like micropulse laser therapy or topical/nasal antioxidants to preserve retinal function. The review “current research and future strategies for the management of vision-threatening DR” [29] emphasized the importance of global strategies to reduce the burden of vision loss, stressing the role of novel serum and imaging biomarkers, AI-assisted handheld retinal cameras for scalable screening, and the integration of predictive models with electronic medical records to support precision medicine, while noting that anti-VEGF therapy, though standard, remains costly and burdensome.
In another study [30], a modified U-Net was developed for automated haemorrhage segmentation in retinal fundus images (IDRiD, DIARETDB1 datasets), achieving high diagnostic performance with 80% sensitivity, 99.6% specificity, 98.6% accuracy, an IoU of 76.61%, and a Dice score of 86.51%. Complementing this, another study [31] introduced a FastViT-based knowledge distillation framework where EfficientNet-B0 served as the student model for DR severity classification using the Asia Pacific tele-ophthalmology society (APTOS) 2019 dataset of 3,662 images across five severity levels. The model achieved an accuracy of 95.39%, precision of 95.43%, recall of 95.39%, and an F1-score of 95.37%, demonstrating both high accuracy and computational efficiency.
Methods
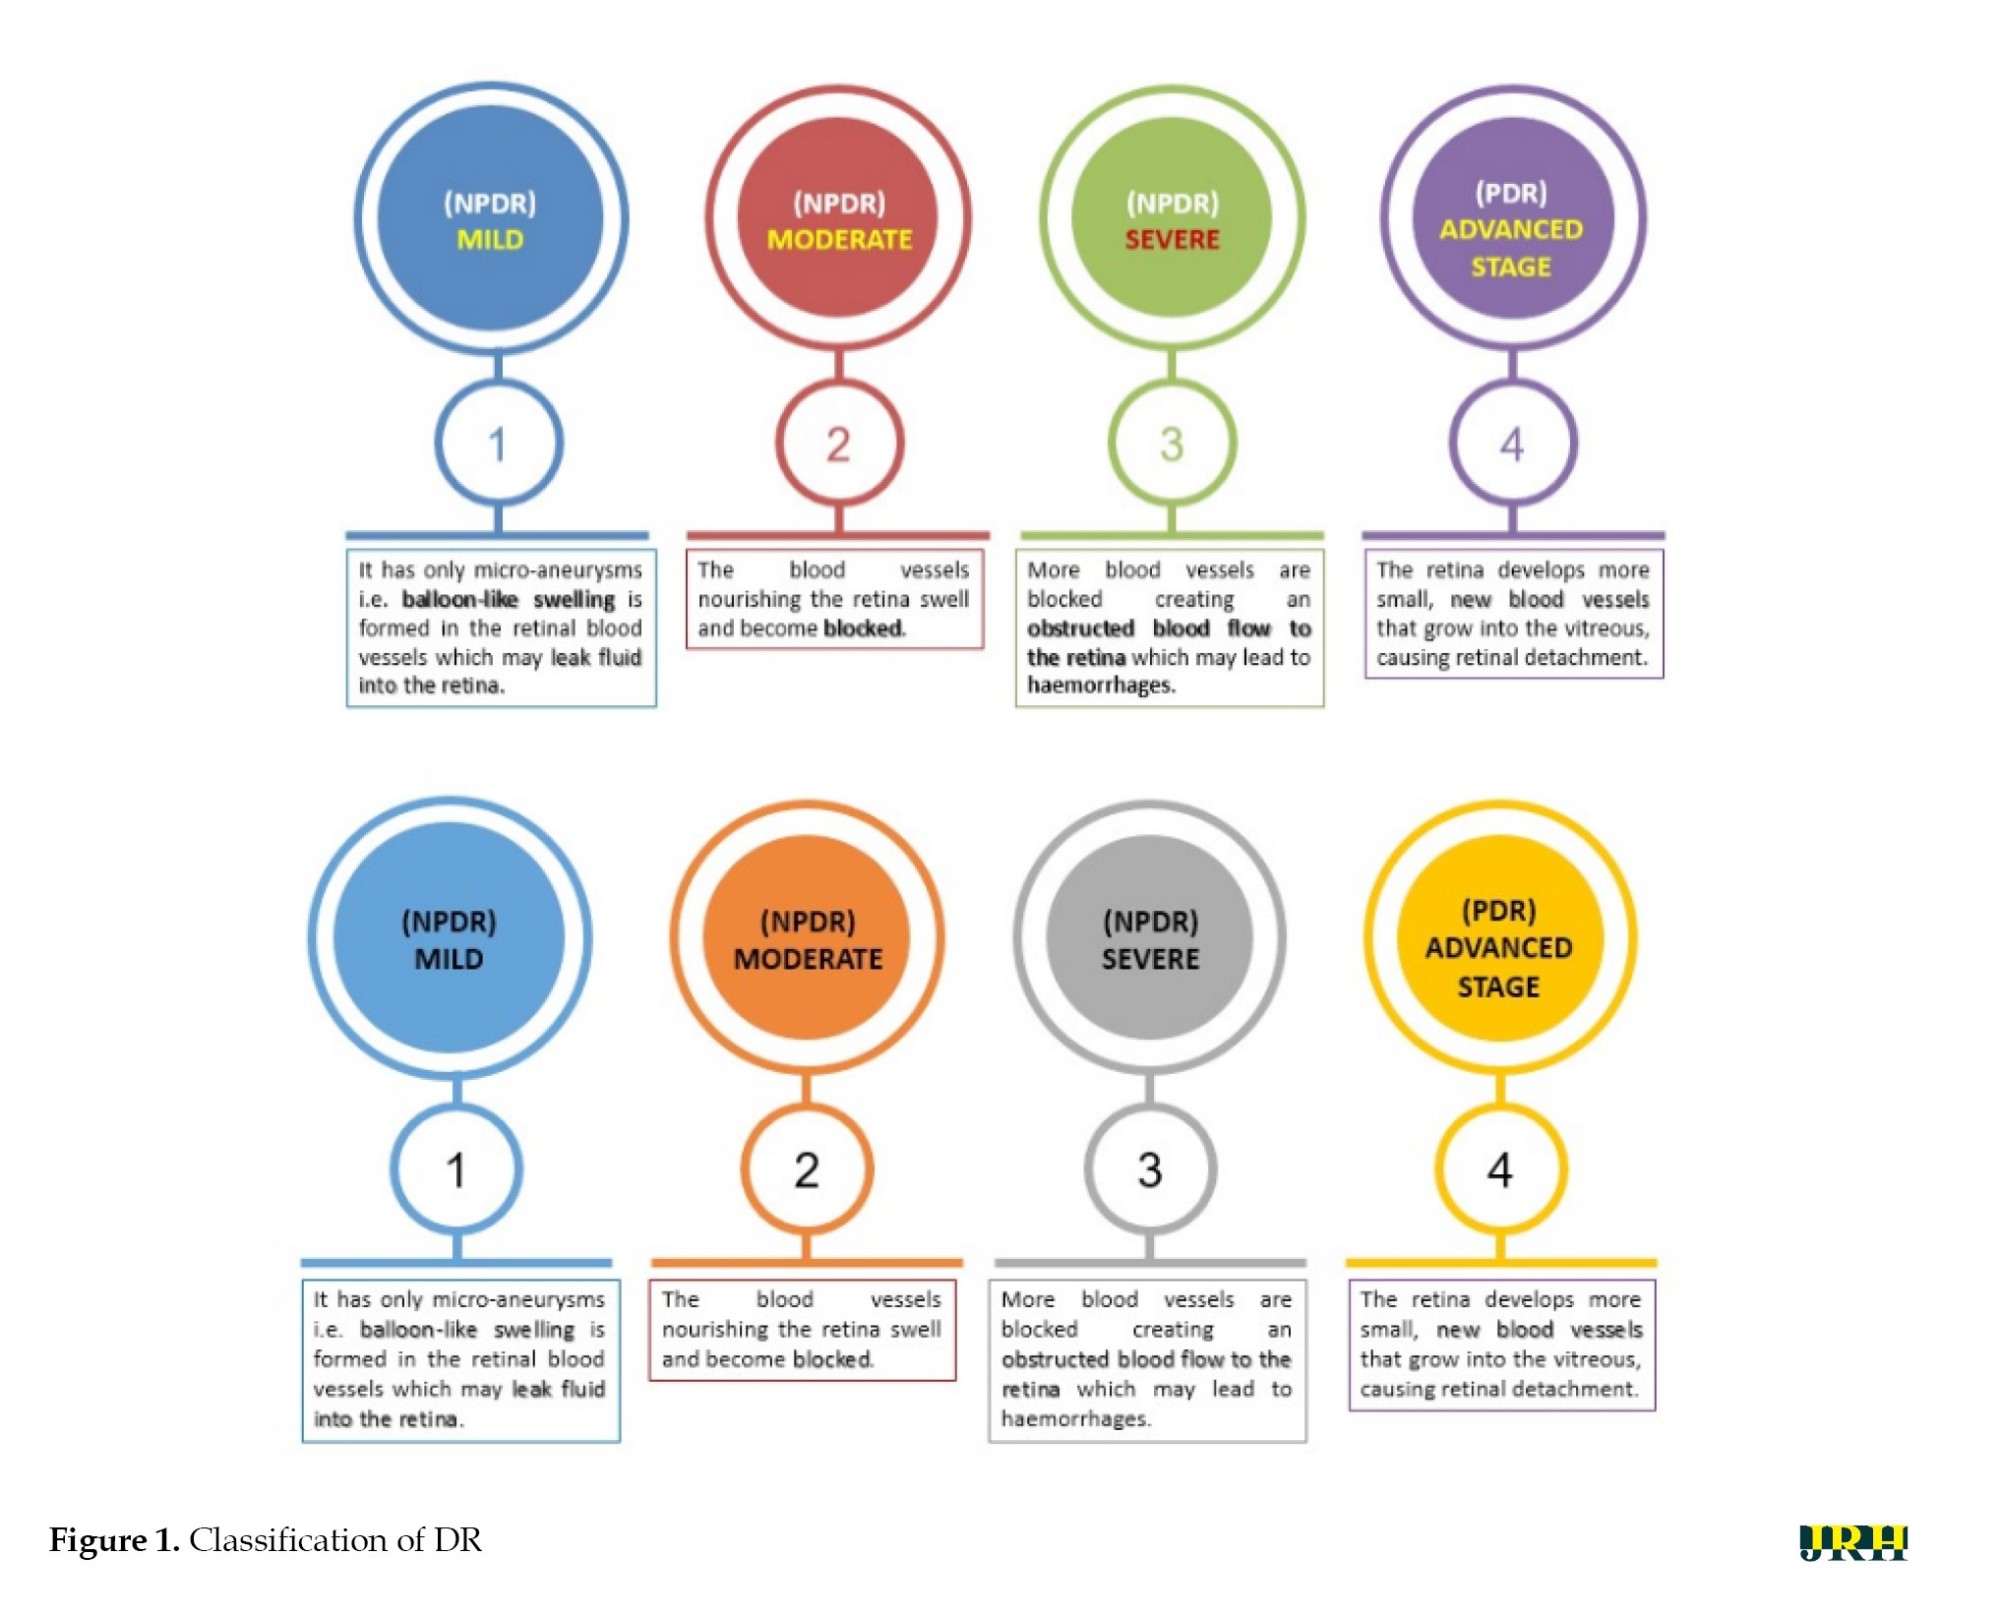
DR can be divided into two stages: Proliferative DR (PDR), which is more advanced and is characterized by the development of new, aberrant blood vessels on the retina, and non-proliferative DR (NPDR), which is an early stage characterized by microaneurysms and retinal hemorrhages as shown in Figure 1.
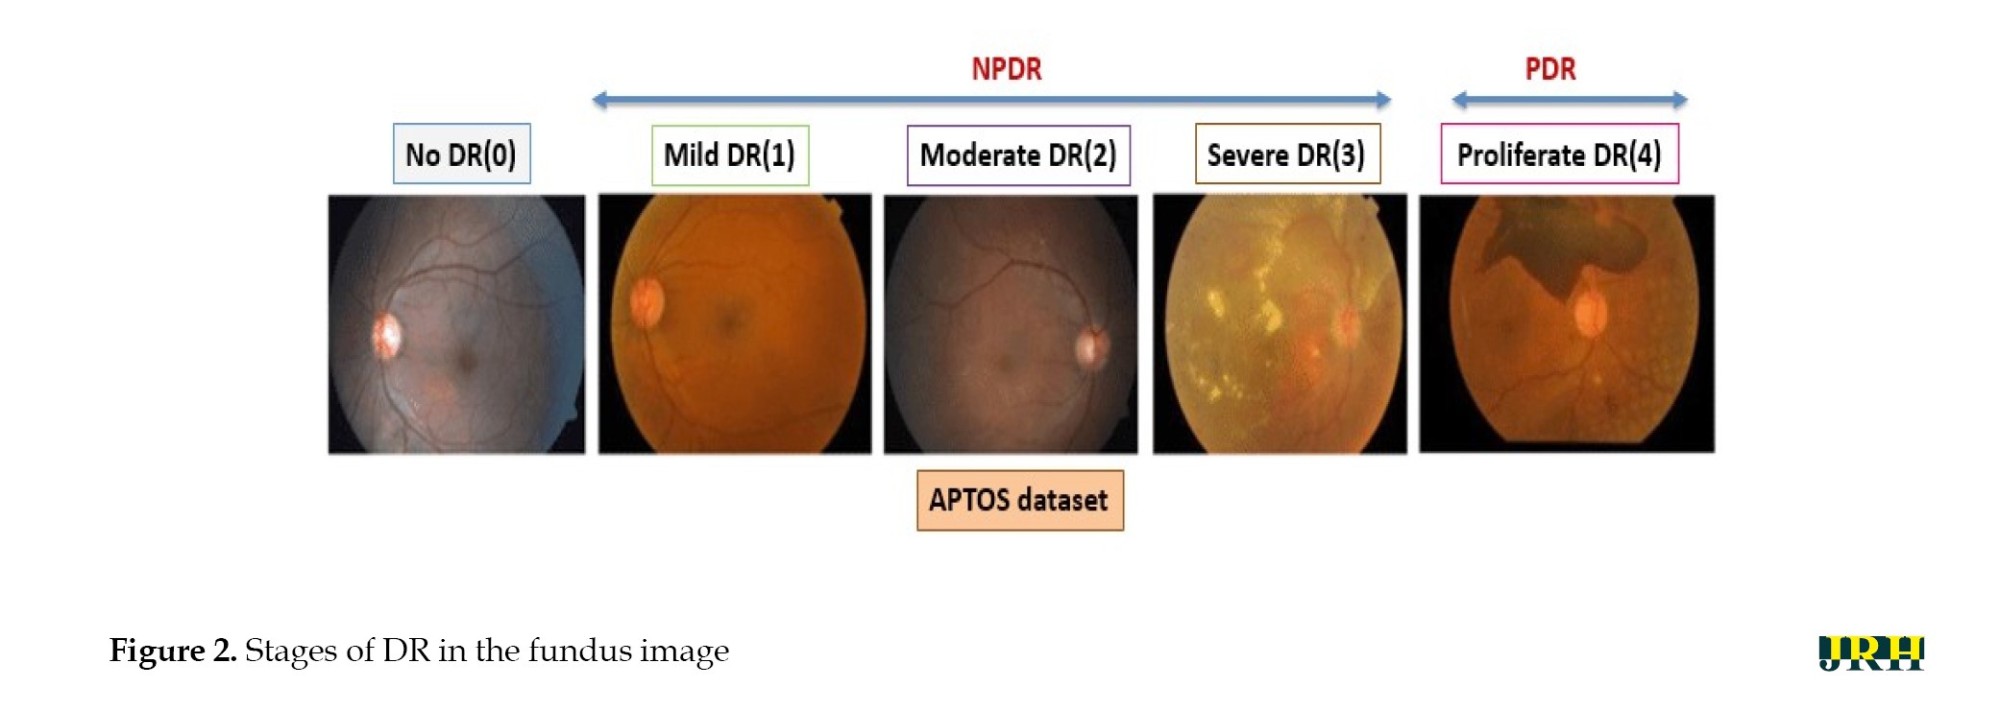
 The fundus images correspond to each stage of DR. The second, third, and fourth stages are classified as NPDR, while the final stage is PDR, which carries a very high risk of vision loss, as shown in Figure 2.
 Deep neural networks are a powerful tool that that assists medical practitioners in analyzing, modeling, and comprehending complex clinical data across various medical applications. The vast majority of applications in the field of artificial computing choose gradient-based back propagation algorithms for neural network training. According to Figure 3, an average neural network consists of three phases: The input stage, the hidden stage, and the output stage.
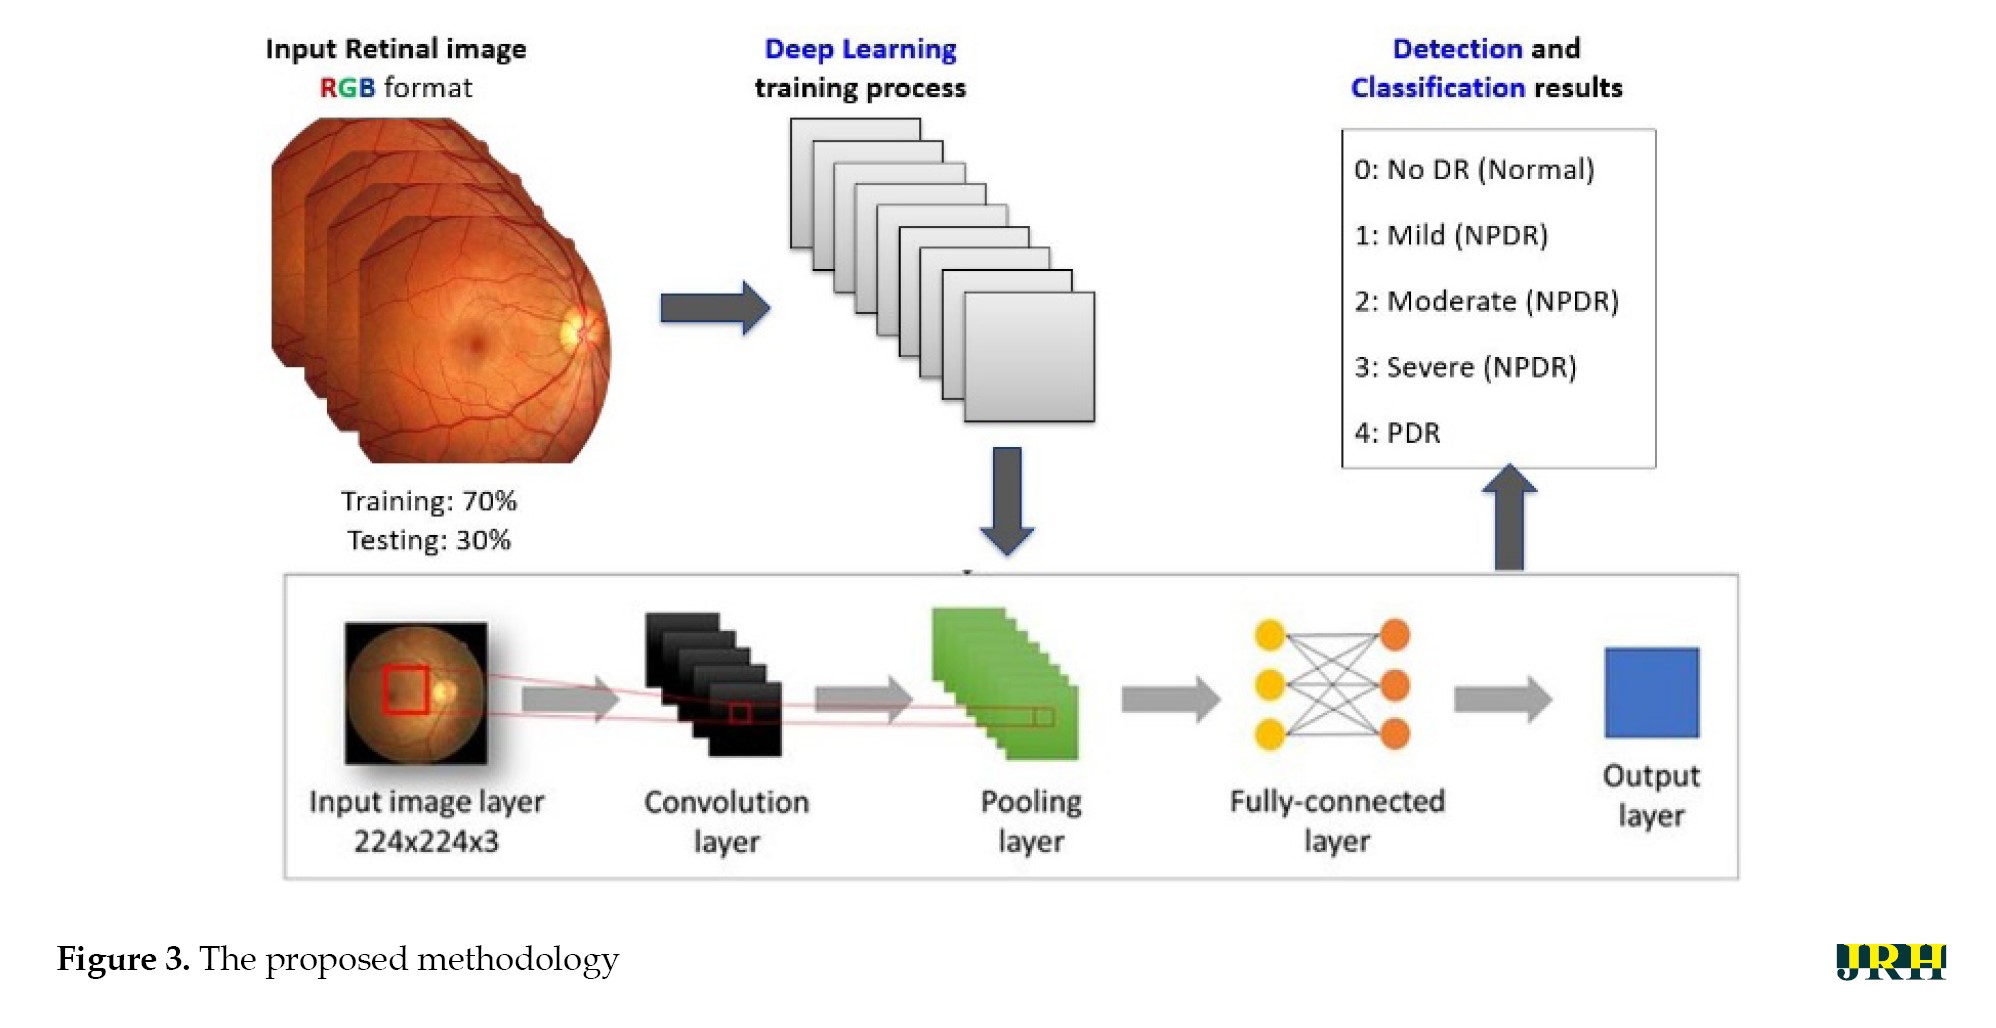 A proposed deep learning model for detecting DR uses 35% of the RGB-formatted input retinal images for testing, while 65% are used for training. The model extracts features from the images using convolution, pooling, and fully connected (FC) layers, categorizing them into five groups: No DR (normal), mild (NPDR), moderate (NPDR), severe (NPDR), and proliferative DR (PDR).
An input retinal image is used to generate a feature vector for the neural network. In the testing phase, a network is built using a wide variety of retinal images to effectively determine if a person has diabetes. To function, the neural network needs to go through two stages: training and testing. Phase segmentation and information extraction are followed by the use of neural networks to identify diabetic retinal disease. Finding features of blood vessels, optical disks, and damage areas is the main goal of diagnosing diabetic retinal illness. The automation of the process necessitates a sophisticated system capable of managing it efficiently. In order to achieve the goals, this work used a CNN with an ANN model. CNN is a widely used DL architecture in computers. The subfield of computer vision in AI enables a computer to comprehend and evaluate visual information, such as images. In ML, ANNs perform exceptionally well and are extensively utilized across various types of datasets that include text, audio, and images. Recurrent neural networks, particularly LSTMs, are used to estimate sequence orders. CNNs are also employed in image classification. In this research, the fundamental elements of a CNN were built. Three different sorts of layers are commonly found in neural networks:
1) The model receives data via the input layer, and the number of neurons in an image is related to its attributes or total number of pixels in an image.
2) The hidden layer receives data from the input layer. The number of hidden layers can be influenced by the model and the volume of data. Although the number of neurons in each buried layer may vary, overall, neurons outweigh features. By applying an activation function, adding biases, and multiplying the output of the preceding layer by learnable weights, each network layer gains nonlinearity.
3) The output layer transforms the data into a more comprehensible format for probability ratings in each class using a logistic function such as softmax or sigmoid. In the next step, called feedforward, data is entered into the model, and outputs are produced for each layer. An error function, such as mean squared error or cross-entropy loss, is then used to evaluate the network’s performance. This error factor gauges the effectiveness of the network. To reduce loss, backpropagation is applied to the model, and derivatives are calculated.
VGG-16 model
The University of Oxford developed the CNN model known as VGG16. In the top five tests, this model achieves a 93% accuracy rate using 15 million images from 1000 classes in the ImageNet dataset. VGG16 is one of the well-known models used in the results of the imagenet large scale visual recognition challenge (ILSVRC). This model performs better than AlexNet by eliminating large kernel-sized filters and replacing them with a large number of smaller 3×3 kernel-sized filters. The VGG16 model was trained using the Titan Black GPU from NVIDIA. The architecture of VGG16 is simplified and layered, including all the layers, their input and output sizes, and other architectural characteristics. In VGG16, the number 16 indicates the total number of layers whose weights can be trained. The weights of the thirteen convolutional layers can be altered during training, allowing for the adjustment of two FC layers and one dense layer.
An RGB image with a fixed 224×224 pixel size is fed into the convolution phase. A sequence of convolutional layers, each using filters with a 33 receptive field, is used to convolve with an input image. In one of the settings, eleven convolution filters are used. The input channels of this filter are linearly altered and the activation process is carried out utilizing the non-linear function RELU. The convolution stage is performed with a fixed pixel of 1. Convolutional spatial padding is meticulously calibrated to preserve the spatial resolution after convolution. For 33 convolutions, we can maintain the spatial resolution after the convolution is complete using a one-pixel padding. Five max pooling layers are used following multiple convolutional layers. For the max pooling operation, a window measuring 224 pixels by 224 strides is utilized. The convolutional layer stack is followed by three FC layers. There are 4096 units in each of the first two FC-connected tiers. The third FC layer has 1000 units because this model must categorize 1000 different classes. The output of the penultimate layer in many multilayer neural networks consists of real-valued scores. However, real-valued scores can be challenging to work with and scale appropriately. In recent years, DR has become the most prevalent type of this illness.
In this research, the traditional VGG-16 architecture was altered to work better for processing the retinal fundus images. To reduce overfitting and computational complexity, optimized dense layers with fewer neurons replaced the last FC layers. Convolutional blocks were followed by batch normalization and dropout layers to enhance training stability and generalization. Experimental trials were also conducted to fine-tune the optimizer parameters and learning rate to achieve optimal convergence. To detect DH, the modified VGG-16 model was designed to capture both local and global retinal characteristics.
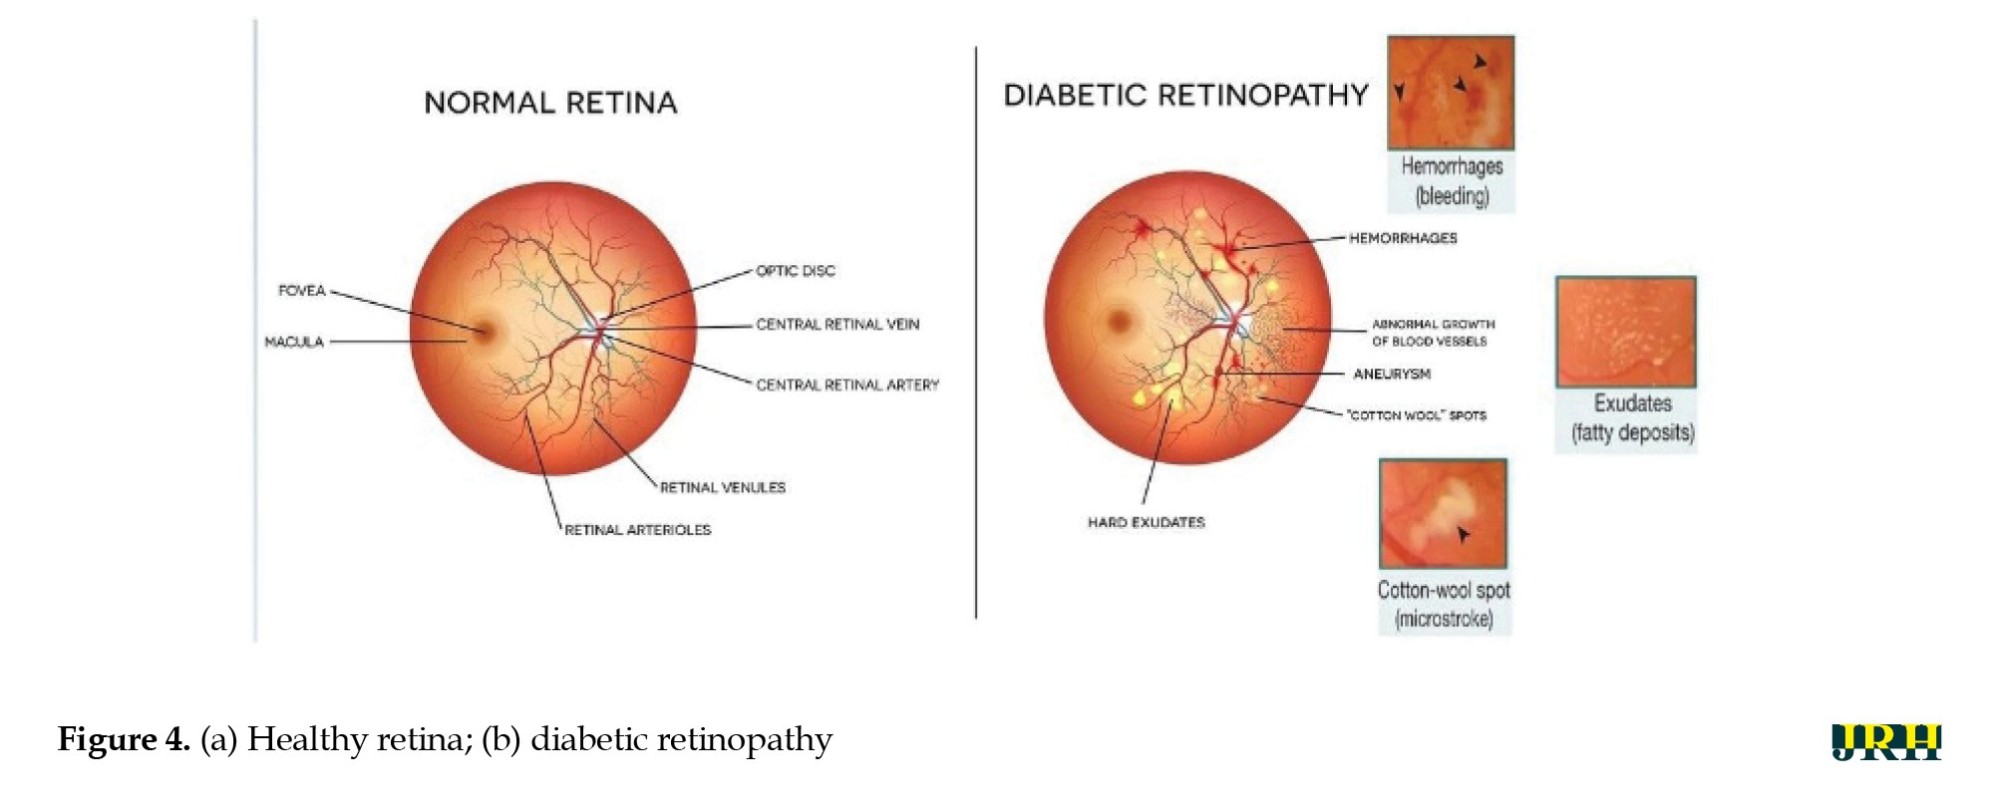
The development of certain retinal hemorrhages may result from the increased fluid and reduced blood flow that enter the eye through the retina’s compromised blood vessels as diabetes worsens. Hemorrhages in the retina could be a sign of an uncontrolled ocular illness or a systemic ailment. One crucial ocular diagnostic sign of a systemic vascular illness is retinal hemorrhages. The size, depth, and pattern of the hemorrhages allow us to make informed guesses regarding the potential underlying cause. Retinal hemorrhages require a multidisciplinary team to identify and treat.
In the present study, the retinal images were classified as DH in the categories of severe, mild, moderate, and no DH based on their severity stages. Both the DHs and normal retinal images as shown in Figure 4 a and b.
 Early detection of these abnormalities could help ensure timely and effective treatment, protecting the eye from blindness. Fundus color retinal images obtained with dilated pupils were used by most researchers. Blood vessels and hemorrhages are identified separately, with classifiers employing high contrast enhancement to detect and rank anomalies.
The primary goal of the current study was to detect dynamic DHs using dynamic foam analyzer inline photometric stereo imaging, which helps to improve the accuracy of early diagnosis. The image abnormalities, which include blood vessels and hemorrhages, are shown in Figure 5.
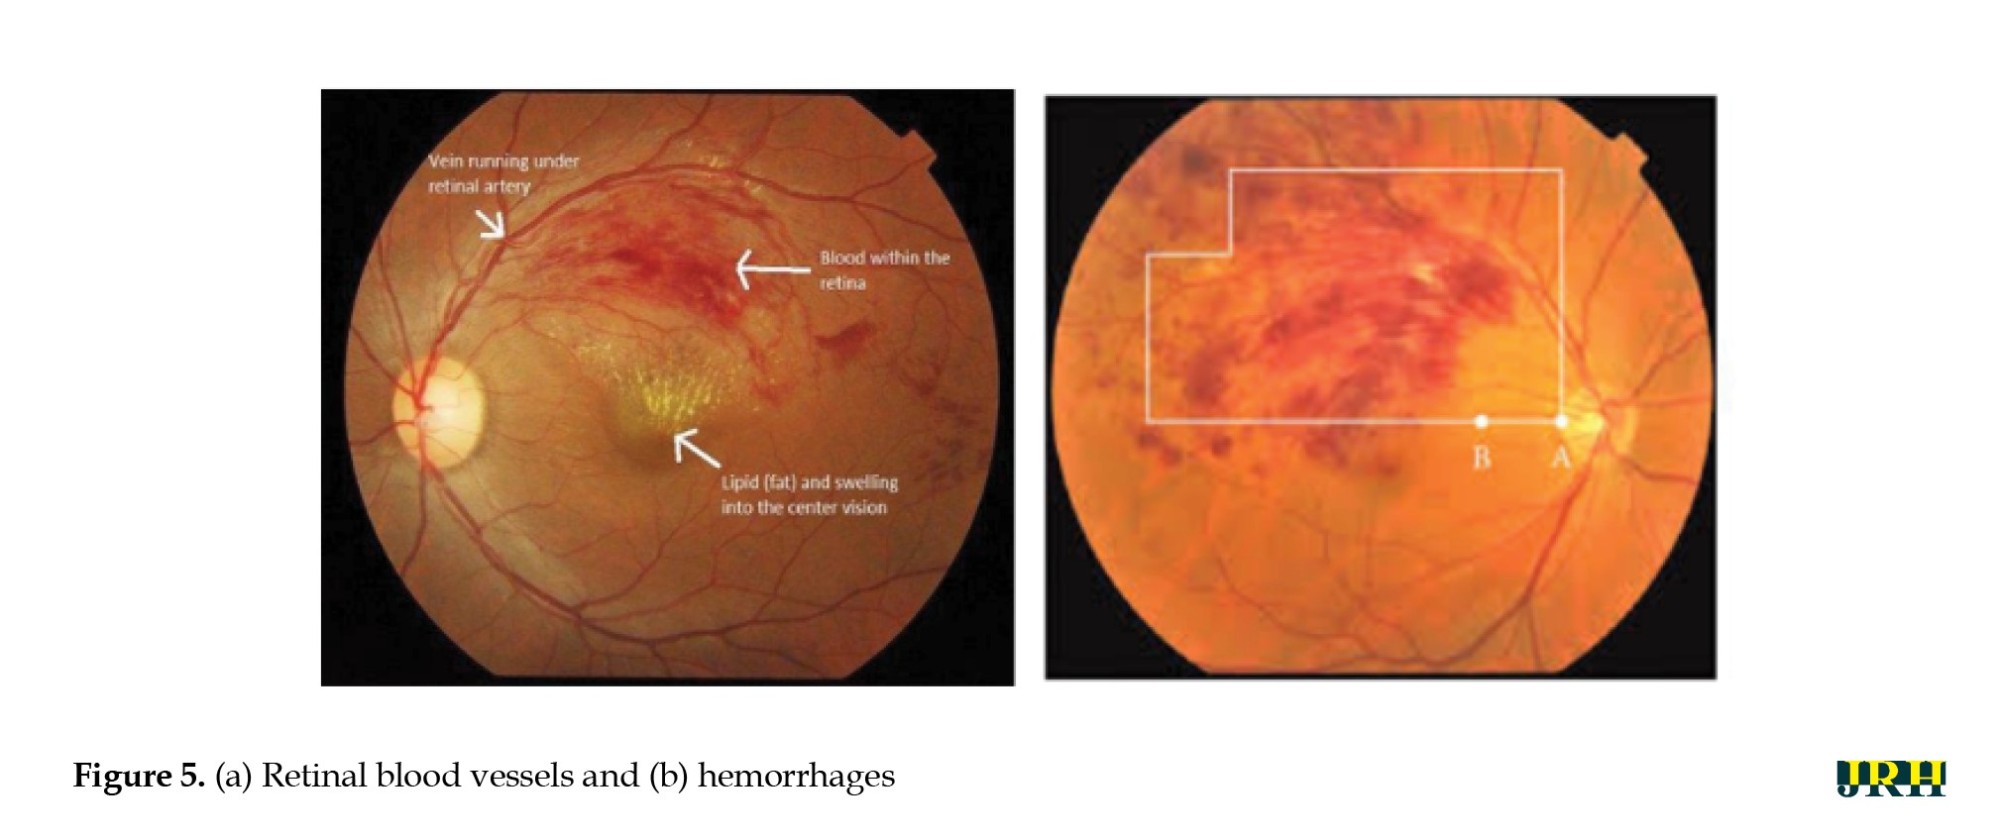 Figure 6 shows a block diagram of the proposed steps for DH identification, preprocessing, testing, and validation.
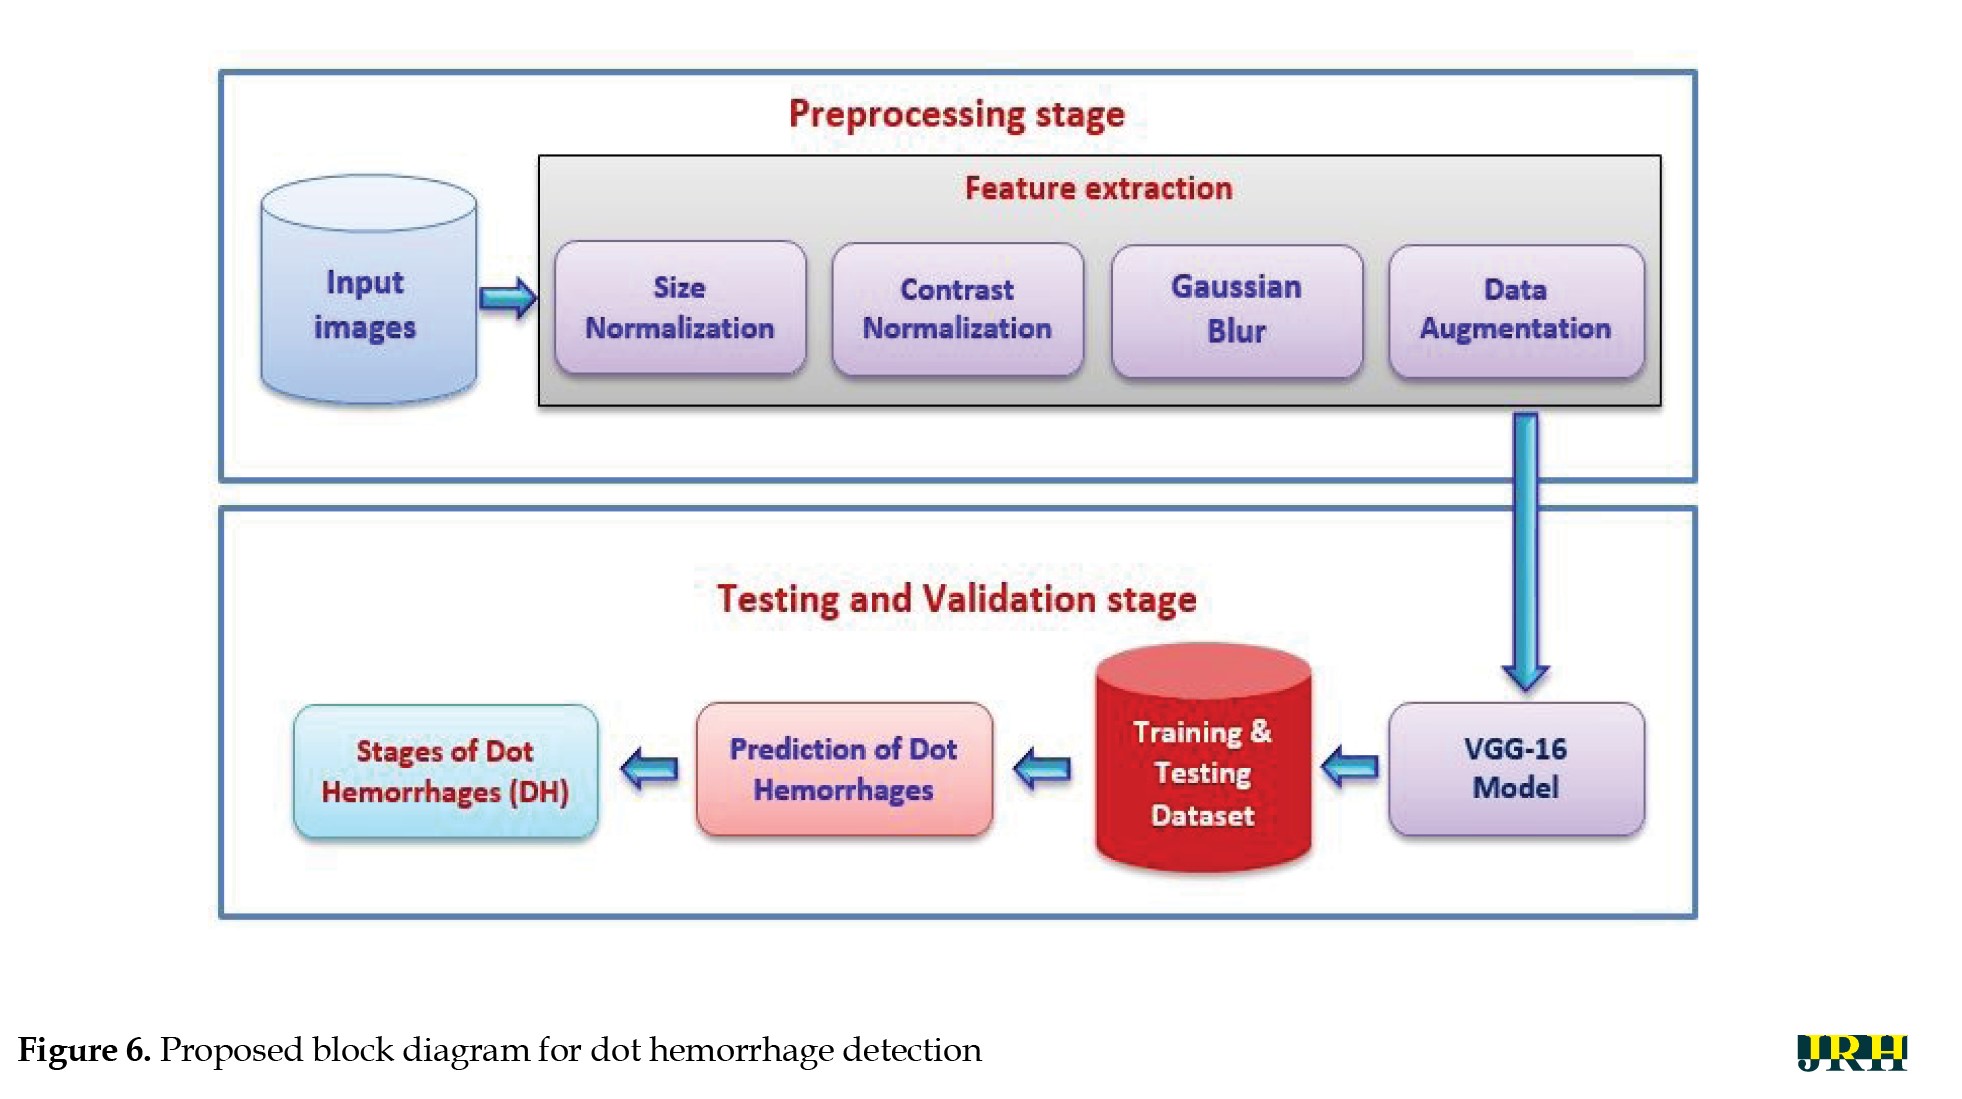 Feature extraction methods, like size normalization, contrast normalization, Gaussian blur, and data augmentation are used during the preprocessing phase. Using distinct training and testing datasets, the VGG-16 model was utilized to predict the stages of DH based on the processed images throughout the testing and validation phase.
Preprocessing stage
The suggested method was assessed using 1928 images for testing and 3662 images for training from the APTOS database. Figure 7 shows sample retinal fundus images from the APTOS and DDR datasets.
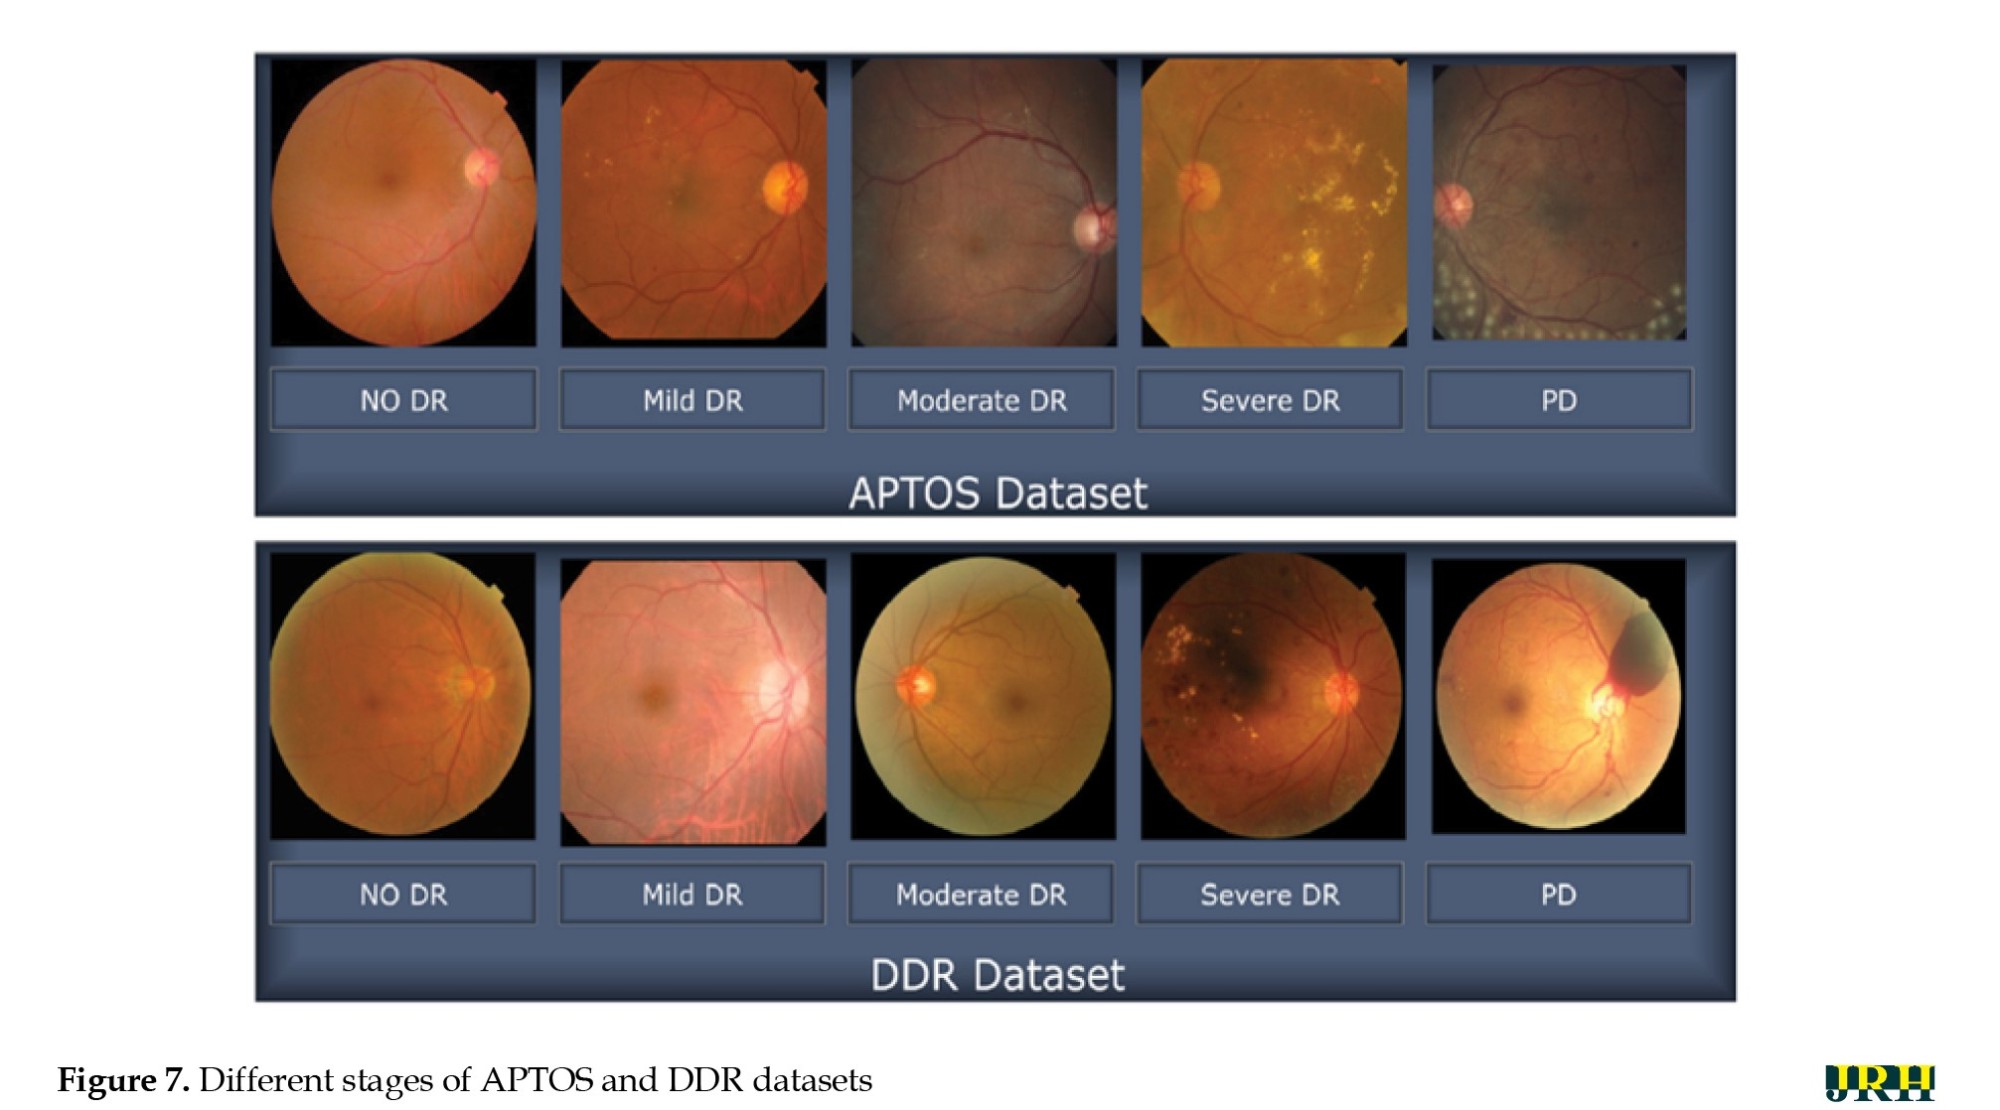 Five types of DR are represented in each dataset: Mild, moderate, severe, proliferative, and no DR (normal). These images illustrate the visual variations and the severity progression of the different stages of DR used to train and evaluate the model.
Image resizing
To ensure a uniform input size that works with DL systems, all retinal images were downsized to 224 by 224 pixels. For this size, an empirical selection was determined following size normalization. For effective analysis and model training, it is essential to maintain consistency in image dimensions across the dataset.
Figure 8 shows a sample of 15 retinal fundus images in varying sizes.
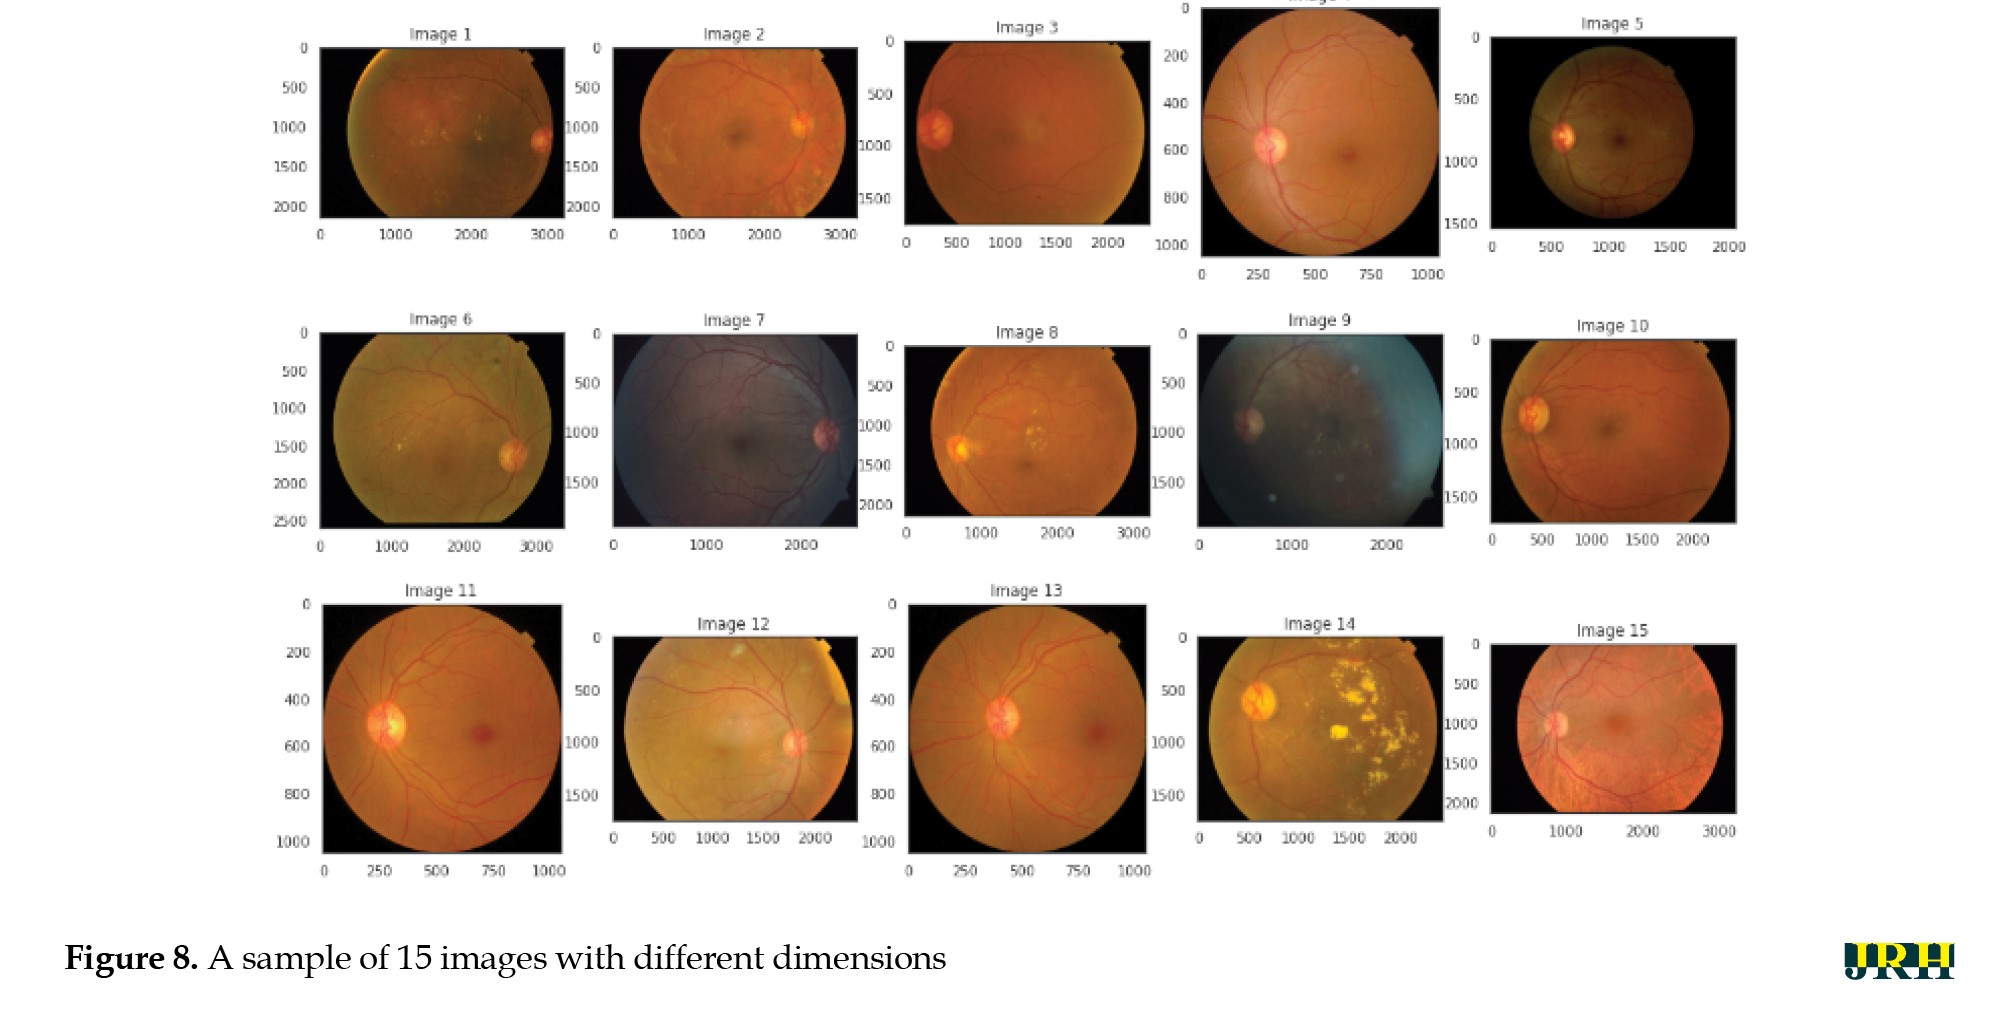 Different phases of DR are represented by the retinal samples in the images, which exhibit differences in image quality, brightness, and contrast. These variations highlight the differences in the input data used for model training and preprocessing. The retinal image data were limited and unbalanced; therefore, data augmentation techniques were employed to increase and diversify the dataset. The original images were enhanced using contrast modification, flipping, and rotation. Flipping and rotating the same image produced different viewpoints, while adjusting the contrast made features more visible. These improvements successfully expanded the dataset, decreased overfitting, and allowed the model to learn more broadly applicable representations of the characteristics of DR.
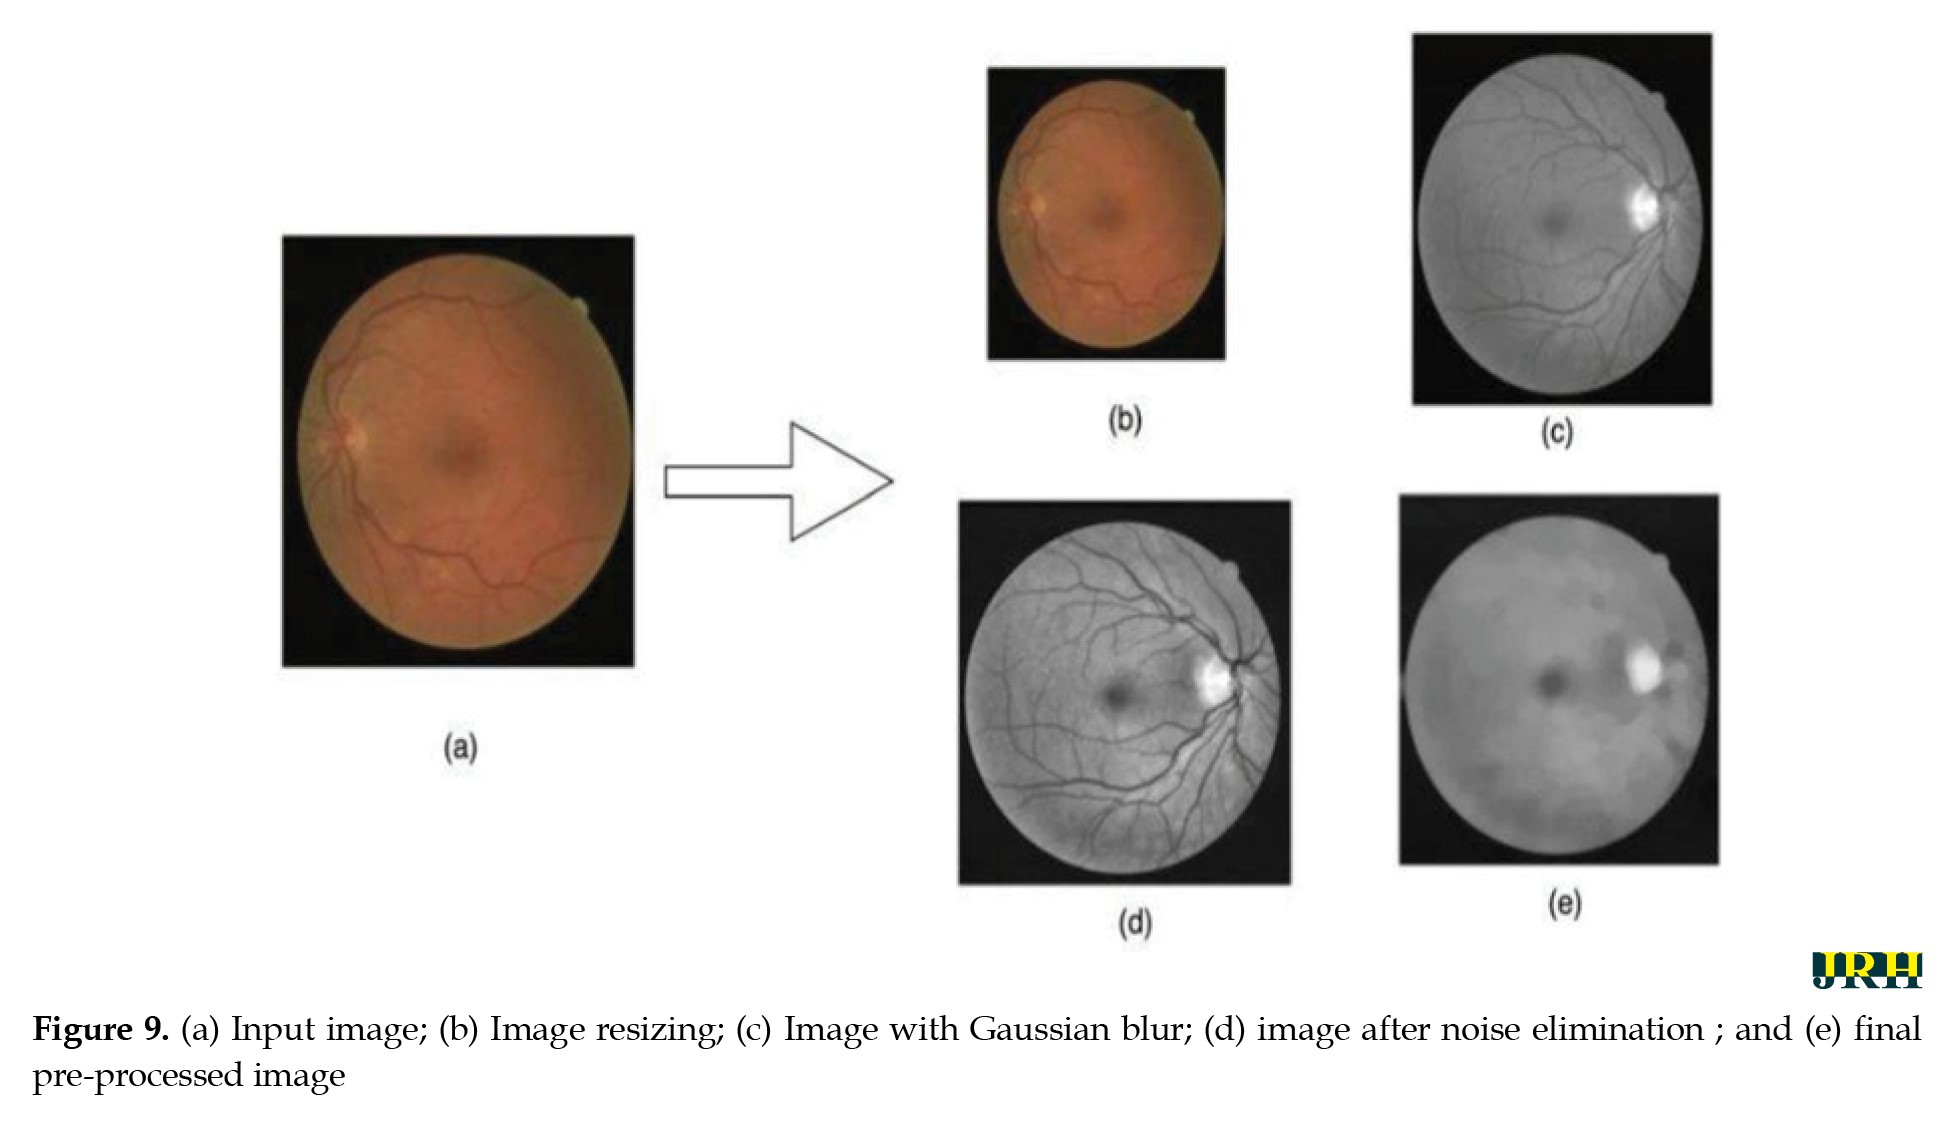
Contrast normalization: To increase contrast, each pixel’s neighborhood mean is subtracted, and the result is divided by the range of pixel values. This process emphasizes subtle retinal characteristics. To address poor contrast caused by glare or uneven lighting, pixel intensity levels are standardized to a defined range.
Gaussian blur: To reduce noise and smooth out images, a linear filter called a Gaussian filter—also referred to as a Gaussian blur [27] was employed. This windowed filter is named after Carl Gauss. The bell-function, often known as the Gaussian distribution, is used to compute the weighted average. It can be applied to spatial issues in one and two dimensions. The cutoff frequency (Fc) of the filter is determined by dividing the sample rate (Fs) by the standard deviation (σ). The following Equations 1 and 2 provide the relationships.
The 1D Gaussian filter is provided using the following equation:
Where ‘G(x)’ is the Gaussian (normal) distribution function, ‘x=0’ is the input pixel intensity or variable under consideration, ‘σ=0’ is standard deviation, which controls the spread (width) of the Gaussian curve, ‘e’ is Euler’s number (the base of the natural logarithm), and ‘π’ is a mathematical constant. This distribution produces a surface with outlines represented as Gaussian-distributed concentric circles extending outward from the center when applied to two-dimensional images.
Image after noise elimination: To improve the clarity of the image’s key characteristics, filtering techniques are usually used to eliminate any leftover noise and artifacts.
Final pre-processed image: The final image utilized for analysis or model training is the one that has undergone all preprocessing procedures. As seen in Figure 9, it is a standardized, noise-free, and cleaned version of the original image that is prepared for additional processing or categorization.
Simulation process
Green channel extraction, contrast enhancement, CNN-based segmentation, training model DL feature extraction
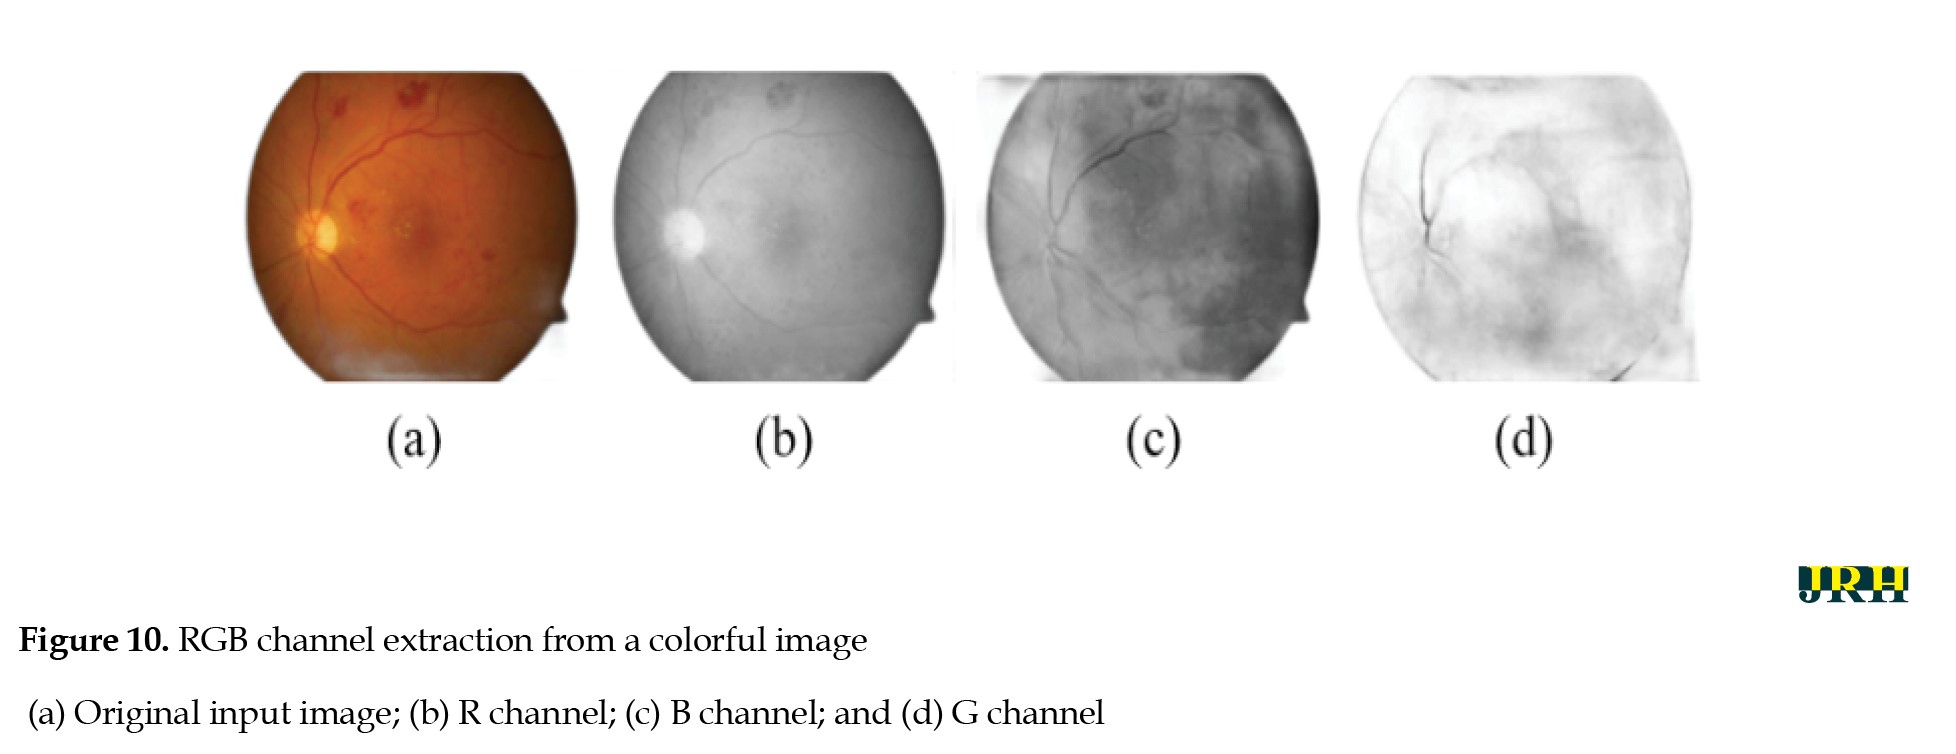
The intrinsic low contrast of retinal fundus images necessitates the improvement of contrast. In order to identify the region of interest (ROI), color input images were converted to the green channel in Figure 10, which offers the highest contrast between exudates, blood vessels, hemorrhages, and the optic disc, making white lesions appear bright and red lesions appear dark.
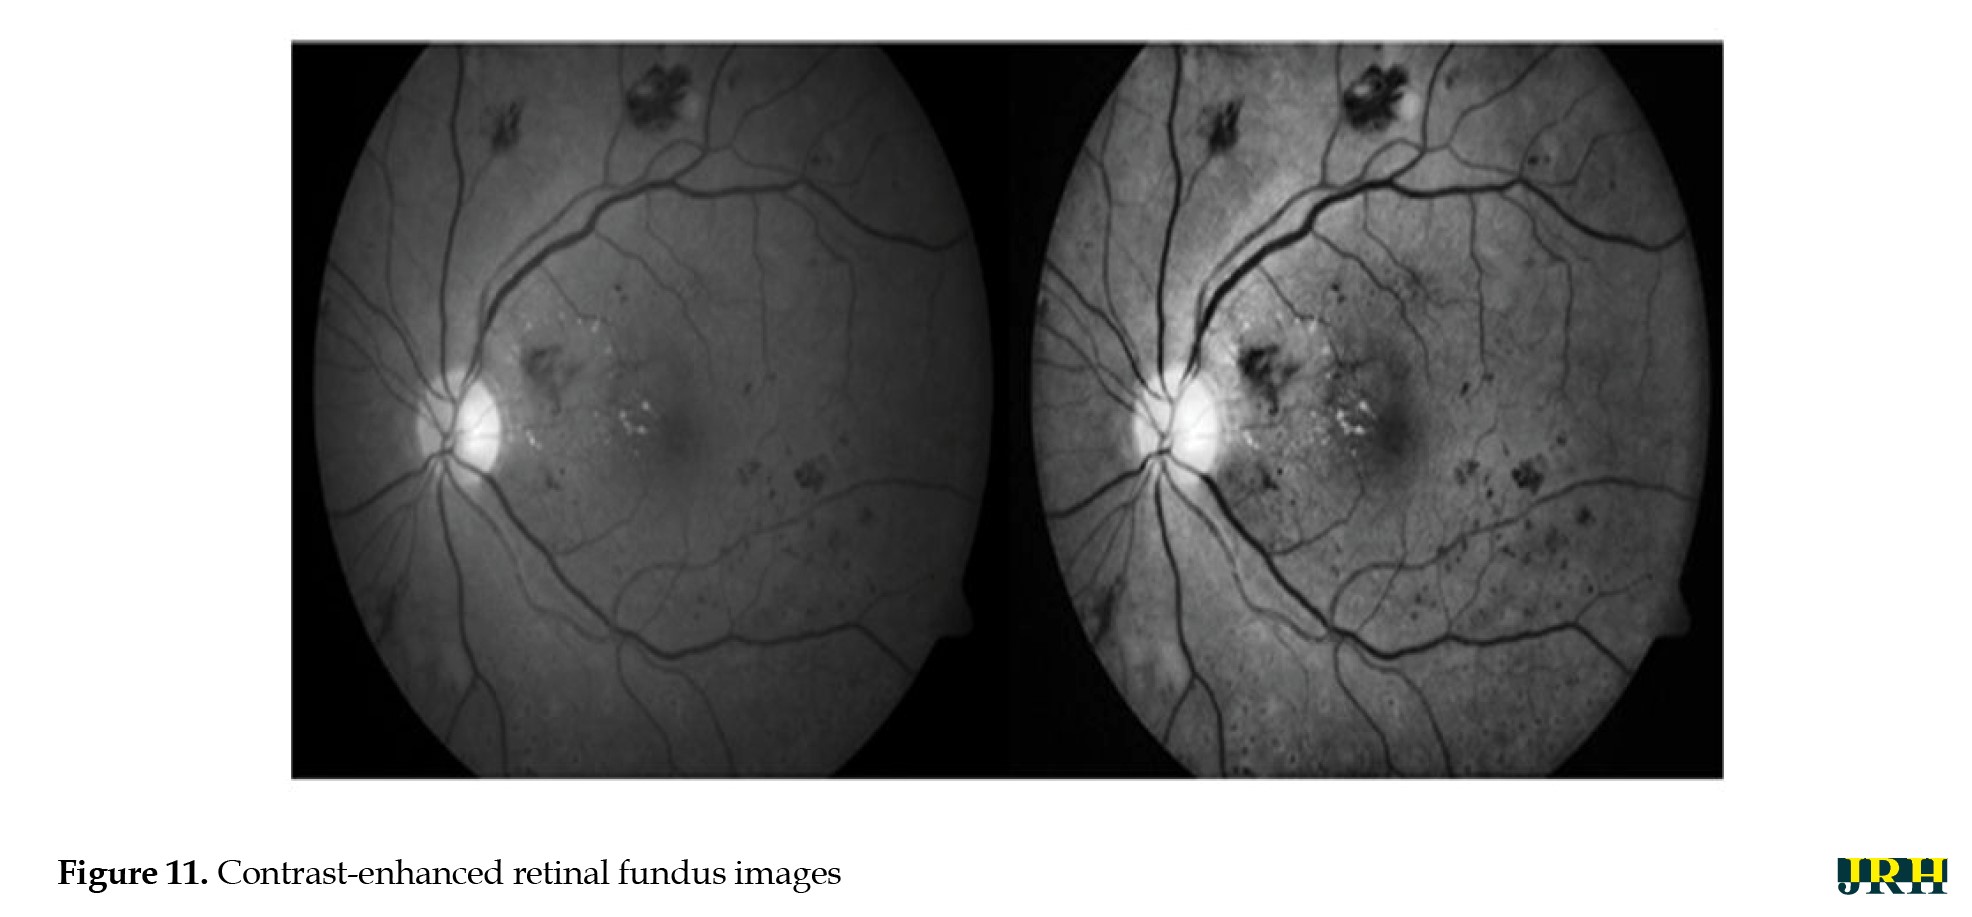
 Contrast enhancement: Contrast enhancement is one of the main pre-processing steps in diagnostic processes. Due to inadequate lighting, the source retinal fundus images lack contrast. The histogram equalization technique proves to be an effective method for improving low-contrast images. To increase contrast while preserving the medium brightness of the input images, an improved version of contrast limited adaptive histogram equalization (CLAHE) is utilized. Figure 11 illustrates how contrast is enhanced through the green ‘G’ channel and demonstrates how our updated contrast enhancement technique significantly improves the gradients.
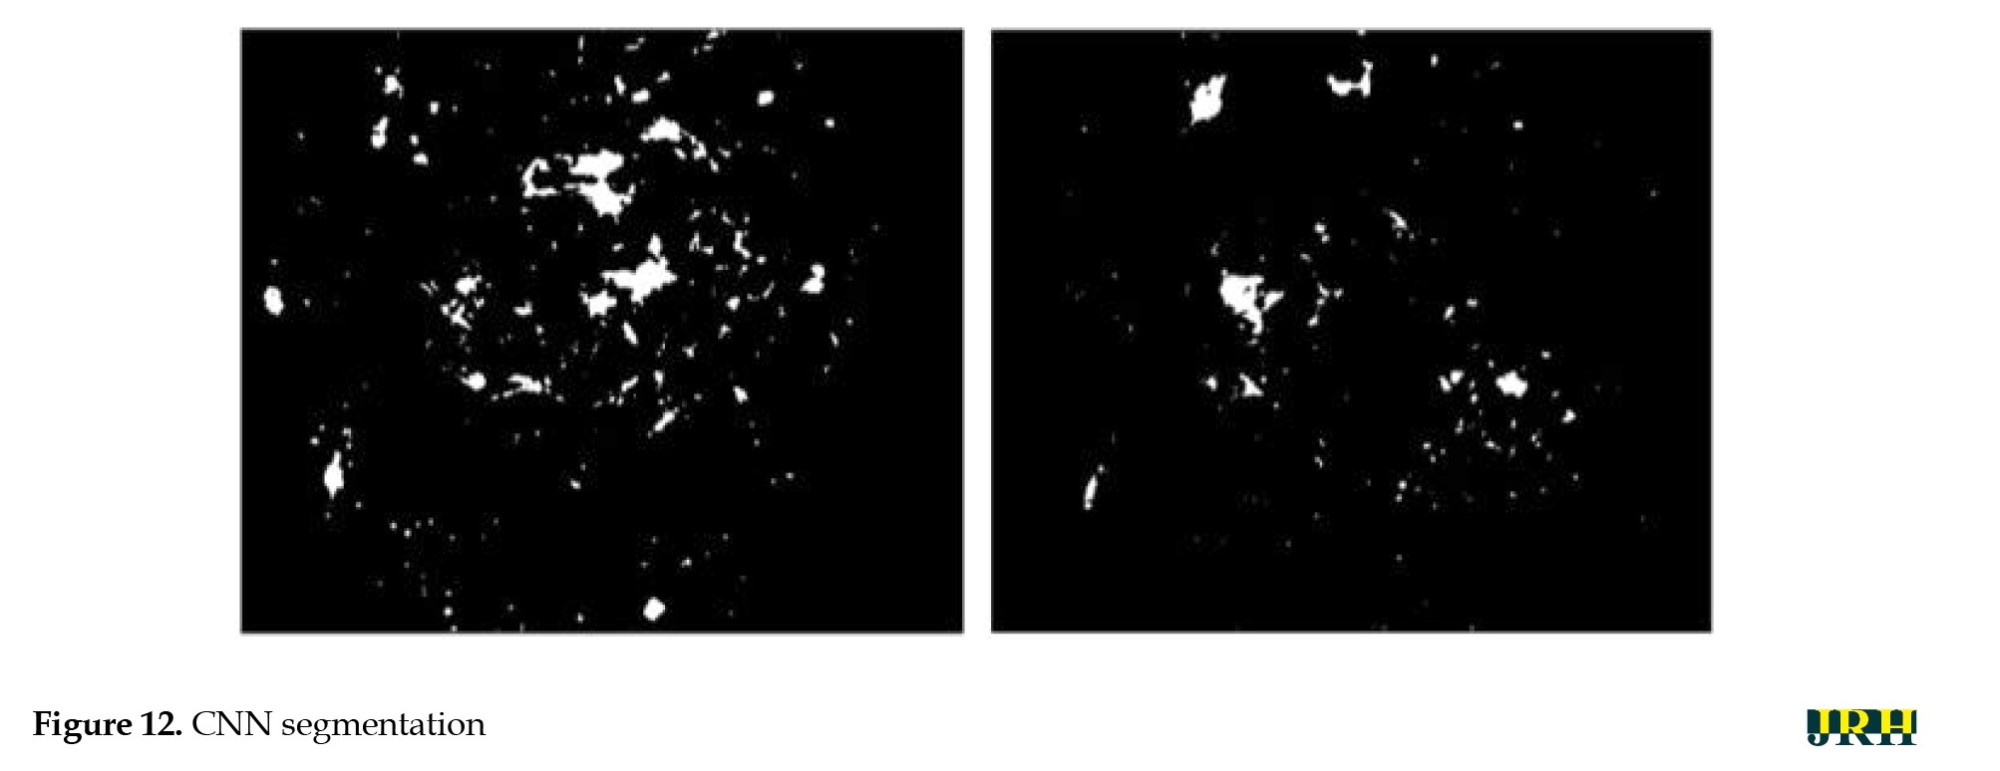
 CNN Segmentation: After the convolutional layer, an activation function is employed to facilitate rapid training. This function identifies all positive values and assigns zeros to all negative values. A max pooling layer is used in CNN layers to downsample the spatial size (h×w) of the feature map, reducing the feature dimensions and eliminating redundant spatial information. This process helps reduce overfitting and improve model efficiency, as shown in Figure 12.
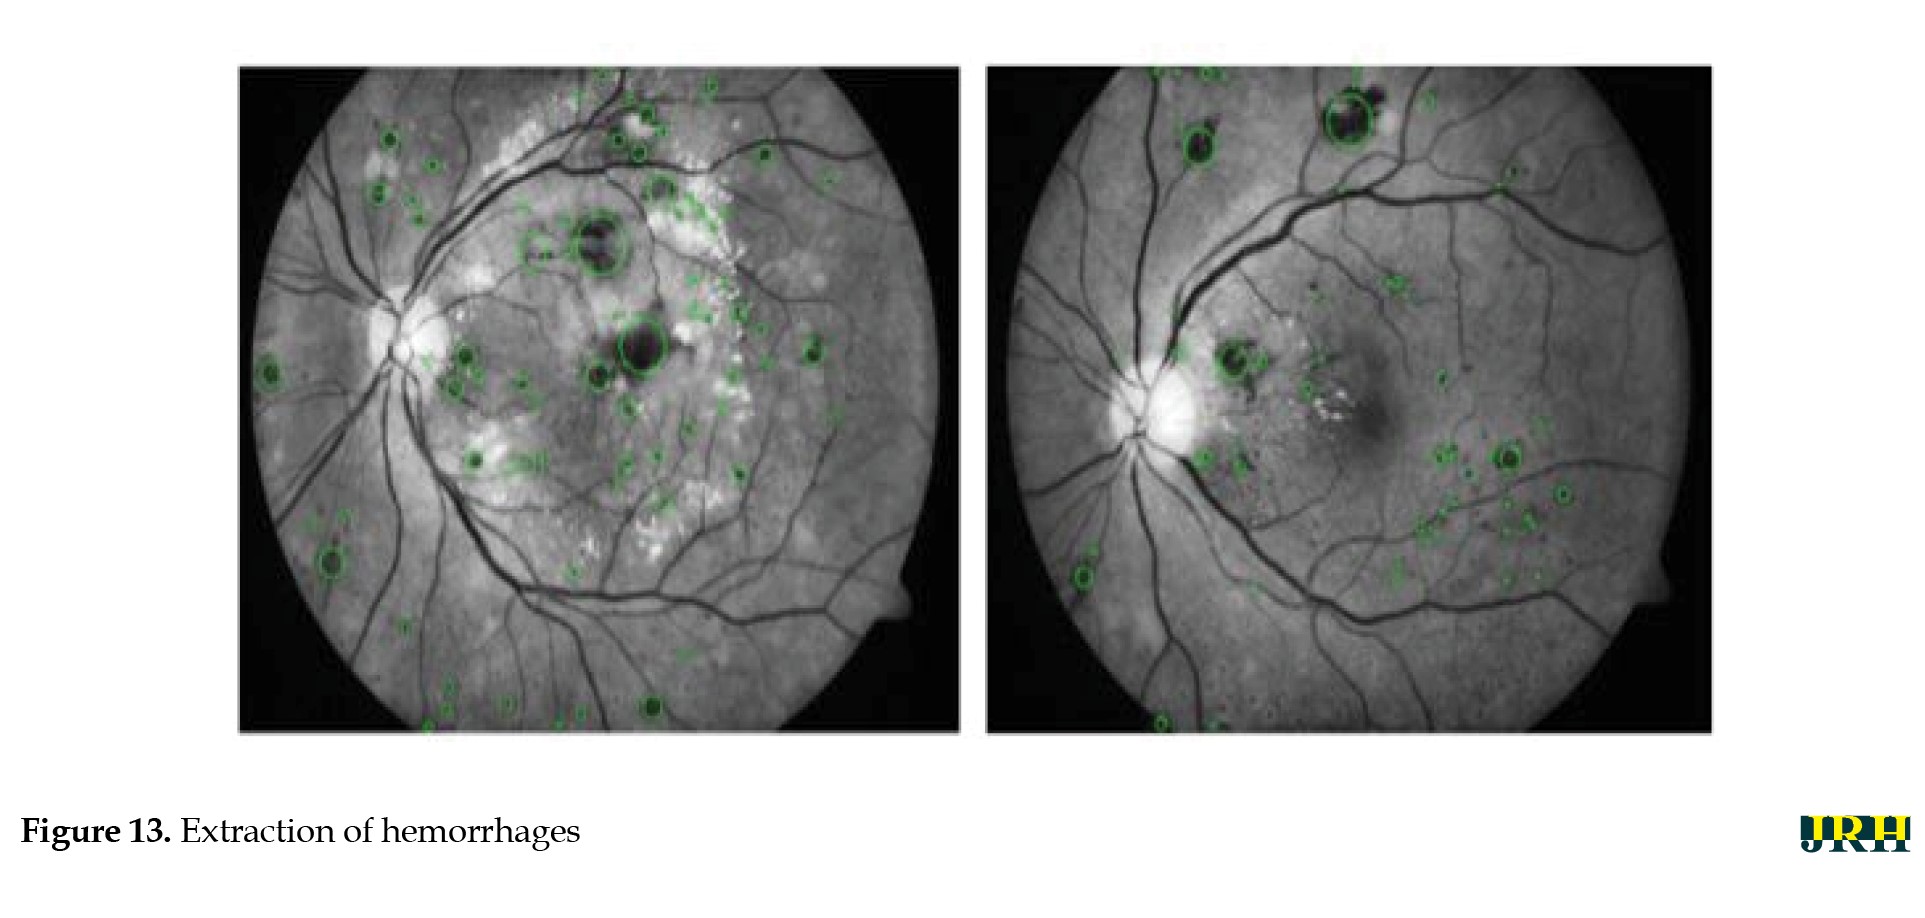
 Extraction of hemorrhages: Feature extraction is critical for identifying true hemorrhages from other retinal features, like blood vessels and noise. After identifying possible bleeding areas, essential parameters, such as area, eccentricity, and intensity variance are calculated to describe them. Hemorrhages are usually seen as small, circular dark spots with low eccentricity and homogeneous intensity. Circularity, compactness, and perimeter-to-area ratio are additional shape descriptors that capture geometric properties, allowing for more accurate classification and fewer false positives in retinal image analysis (Figure 13).
Results
Testing & validation stage
Training models
The evaluation criteria for the trial are described in detail below. The analysis of results, which is conducted in the manner outlined, will be discussed in the next section.
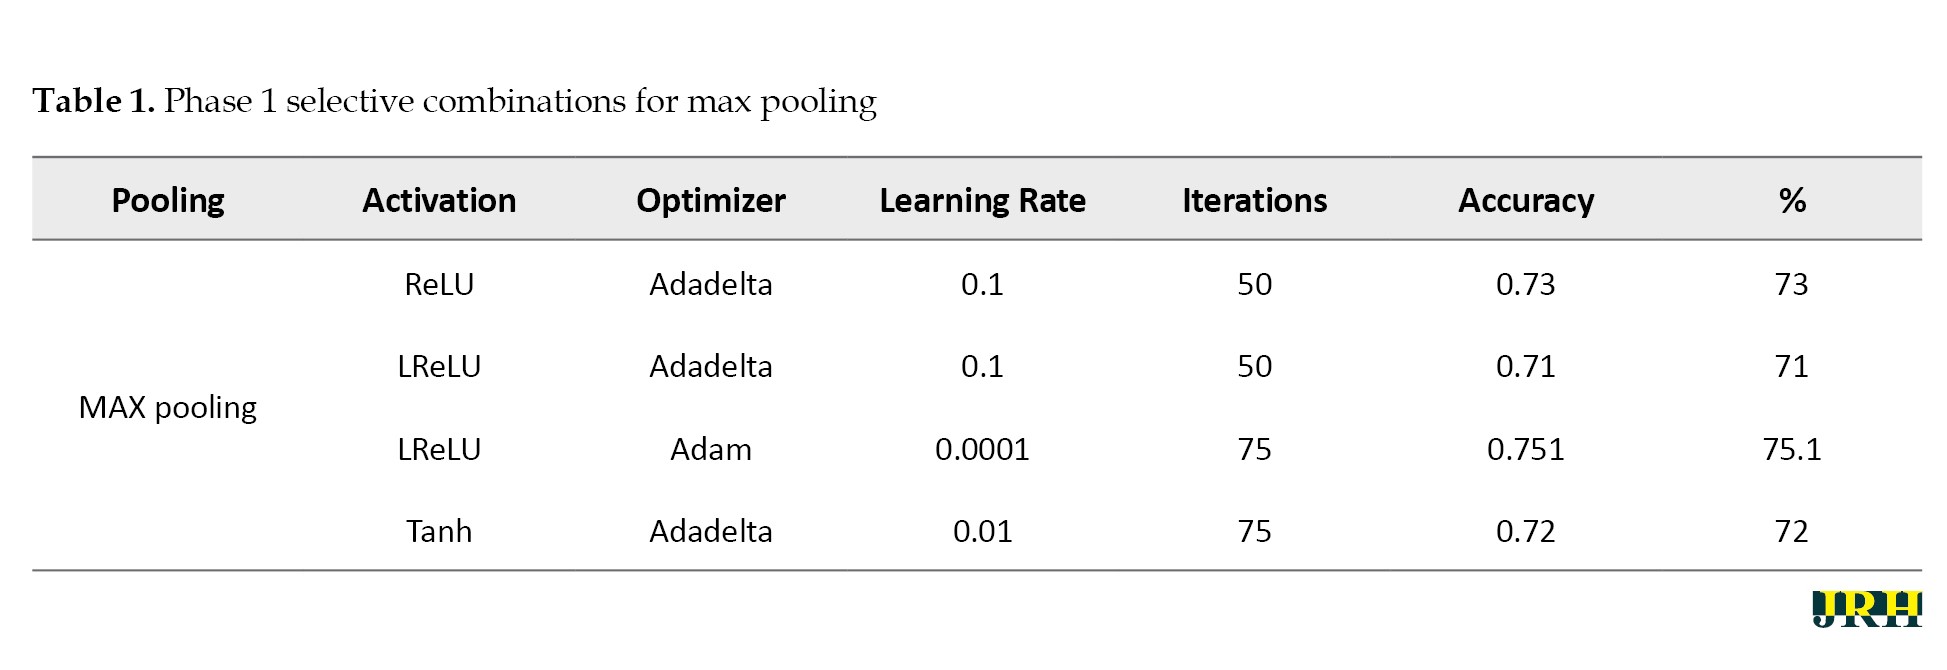
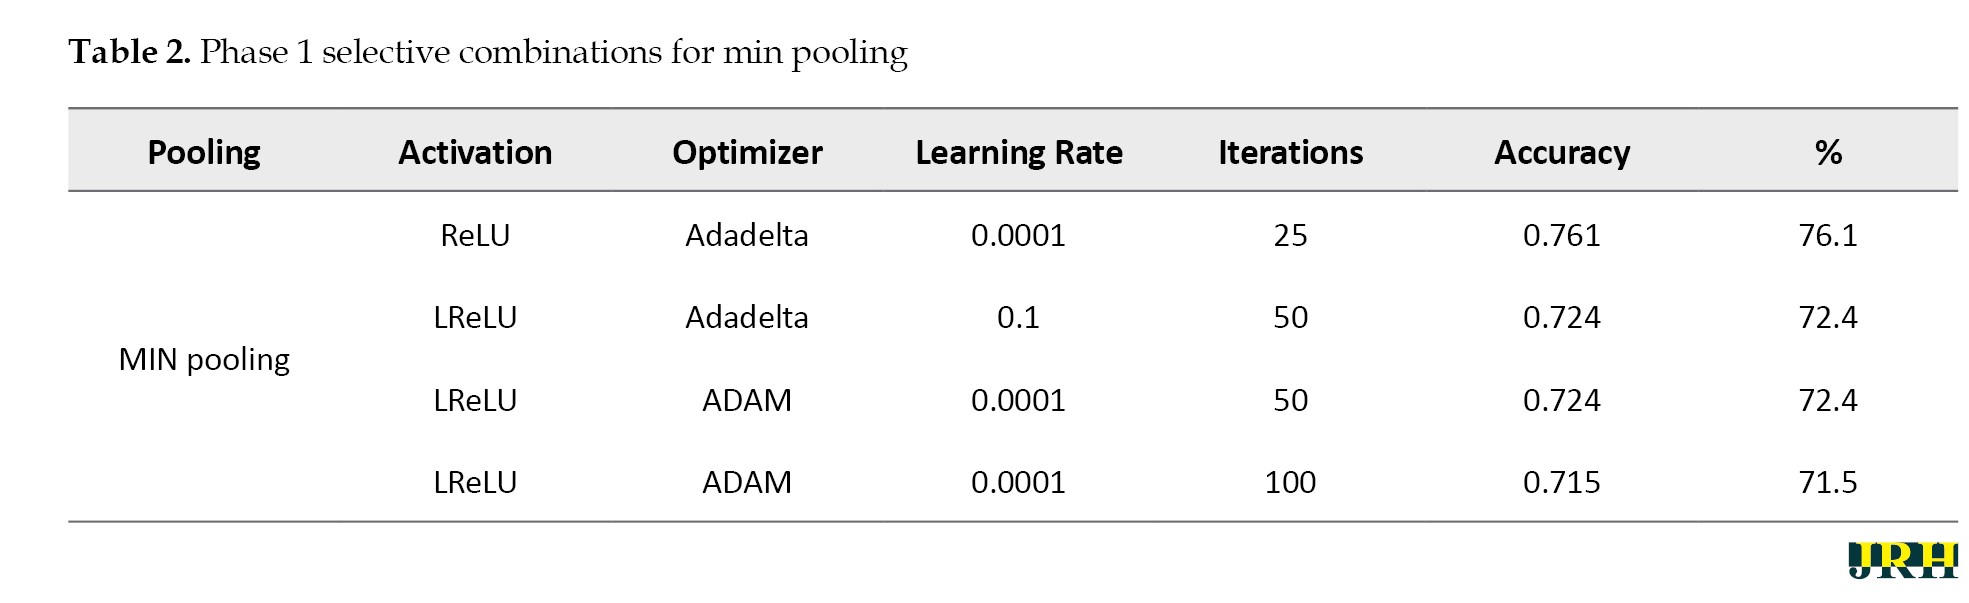
Phase 1: In phase 1, the number of iterations in the model was examined. The following tables display the combinations selected for each pooling along with the accuracy levels tested throughout a variety of iterations. The varying accuracy values for max pooling with various parameters are shown in Table 1.
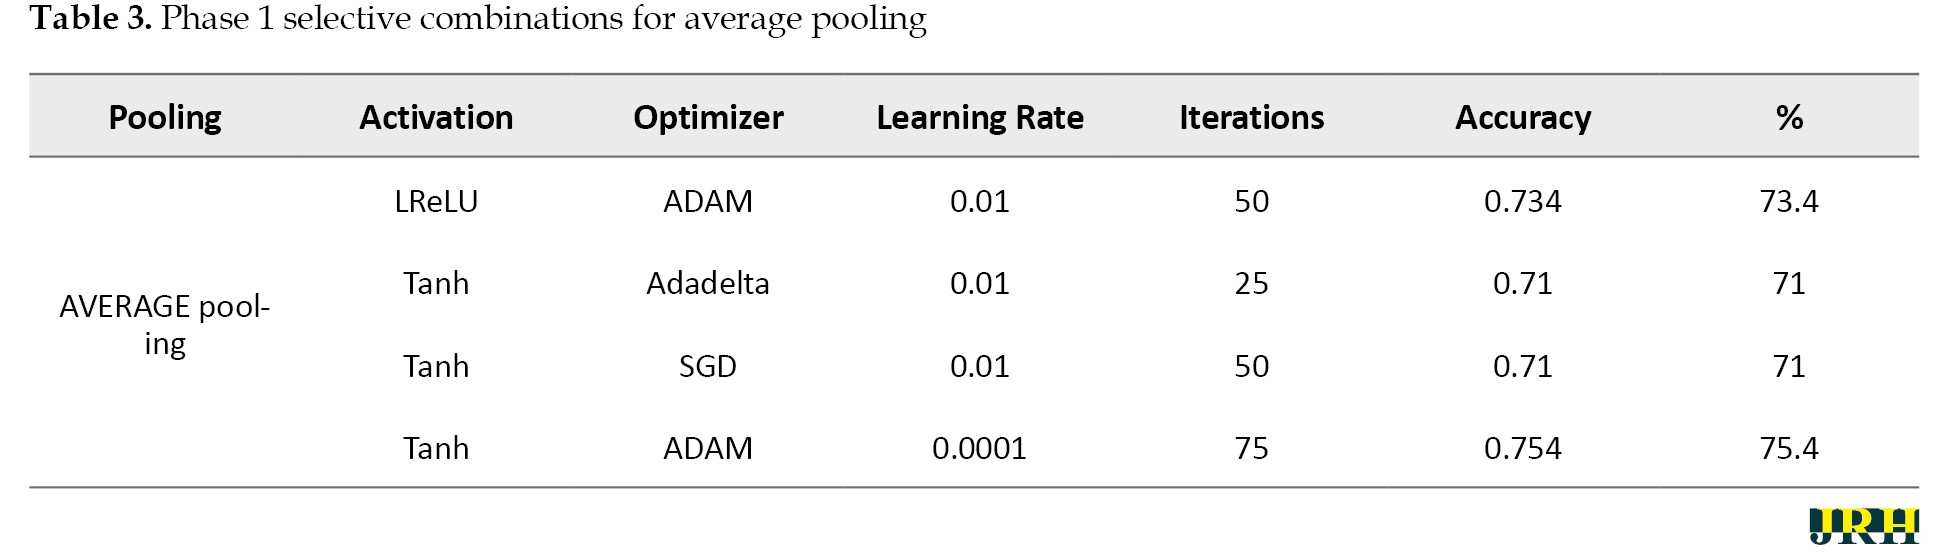
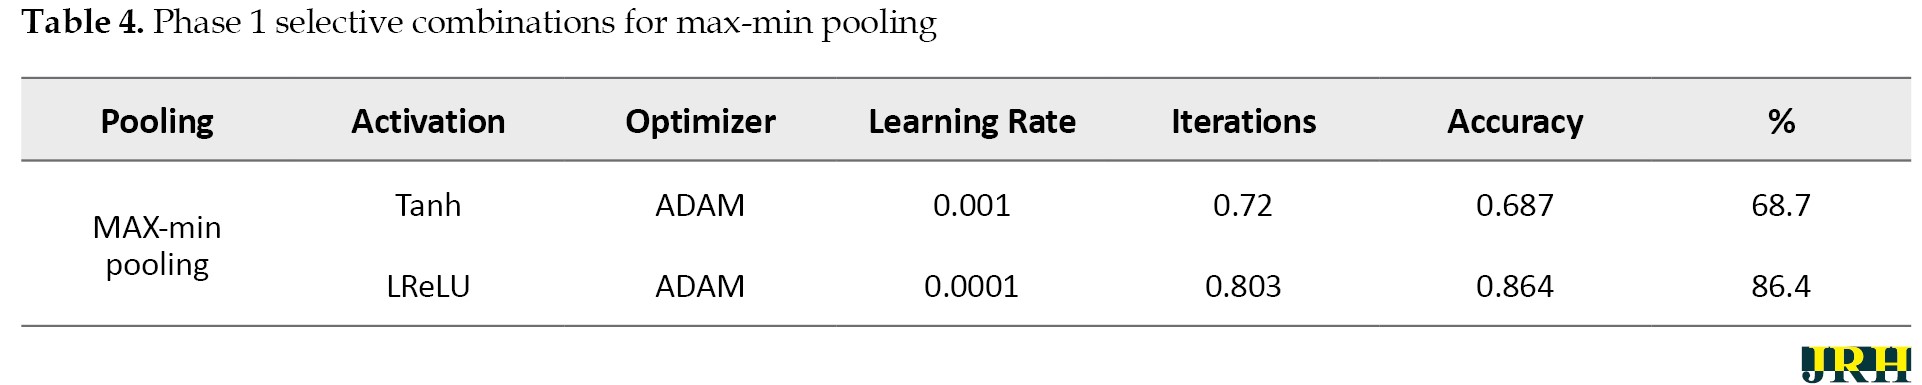
Accordingly, Tables 2, 3, and 4 present the results for min pooling, average pooling, and max-min pooling.
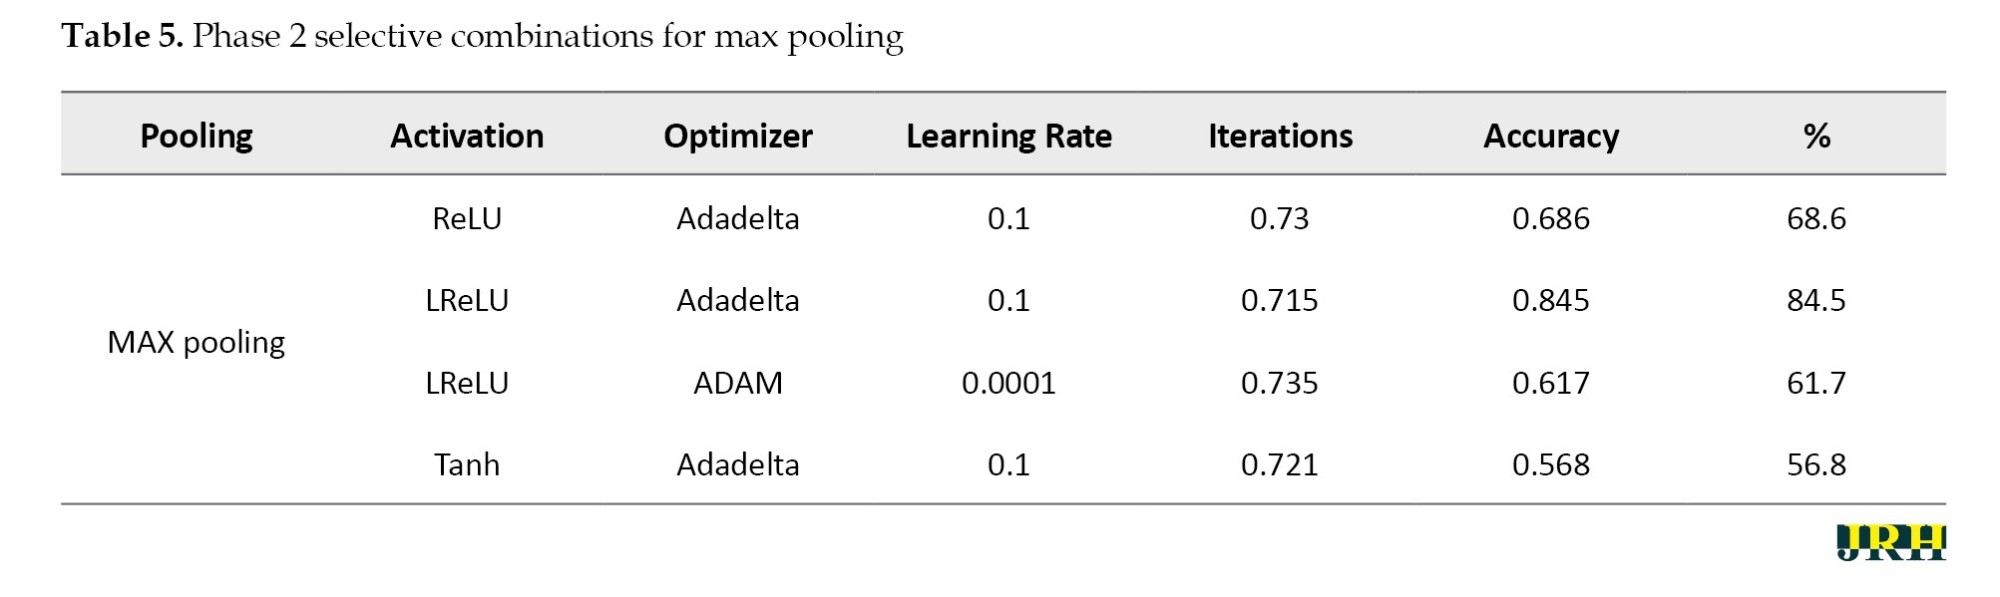
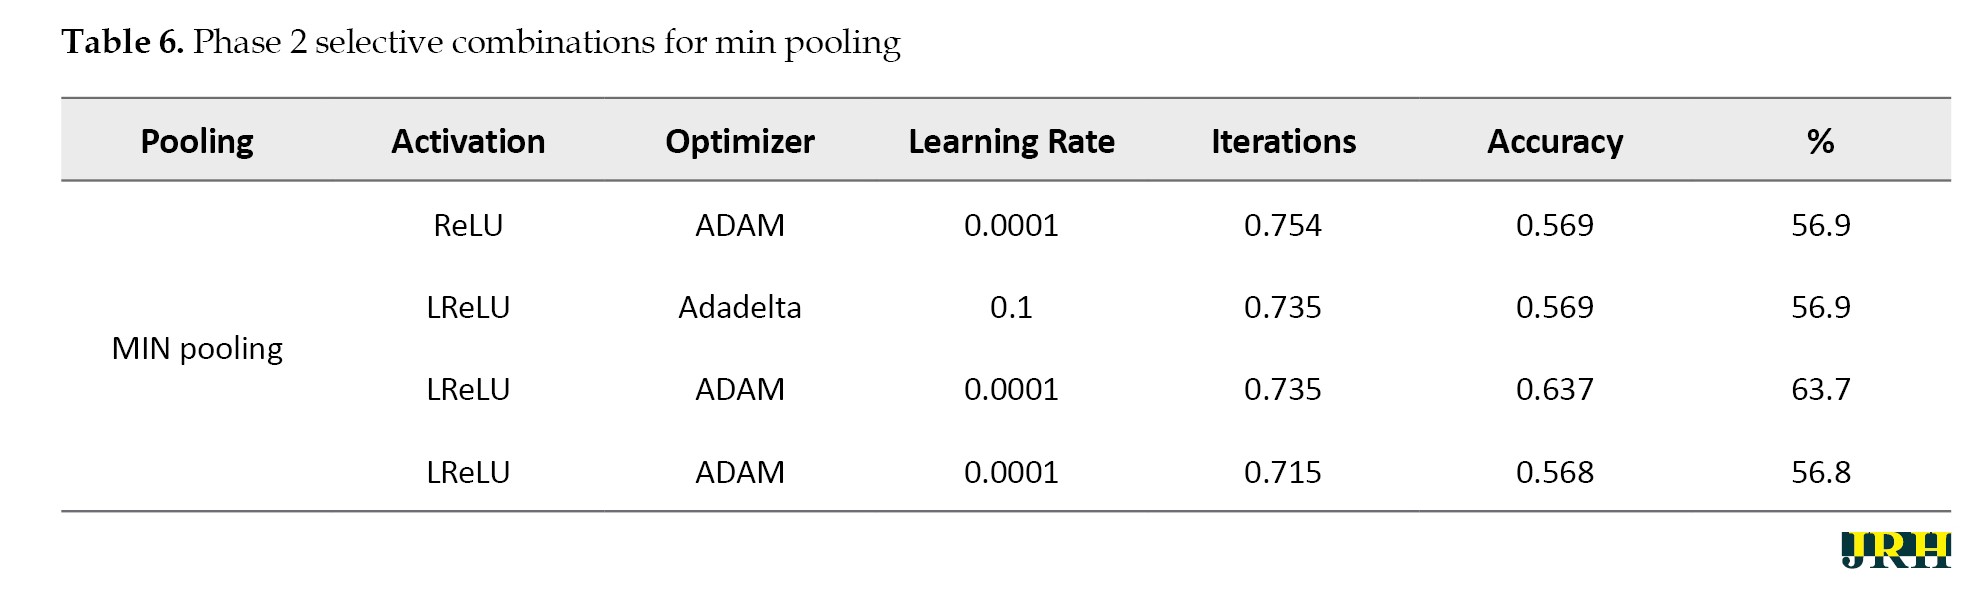
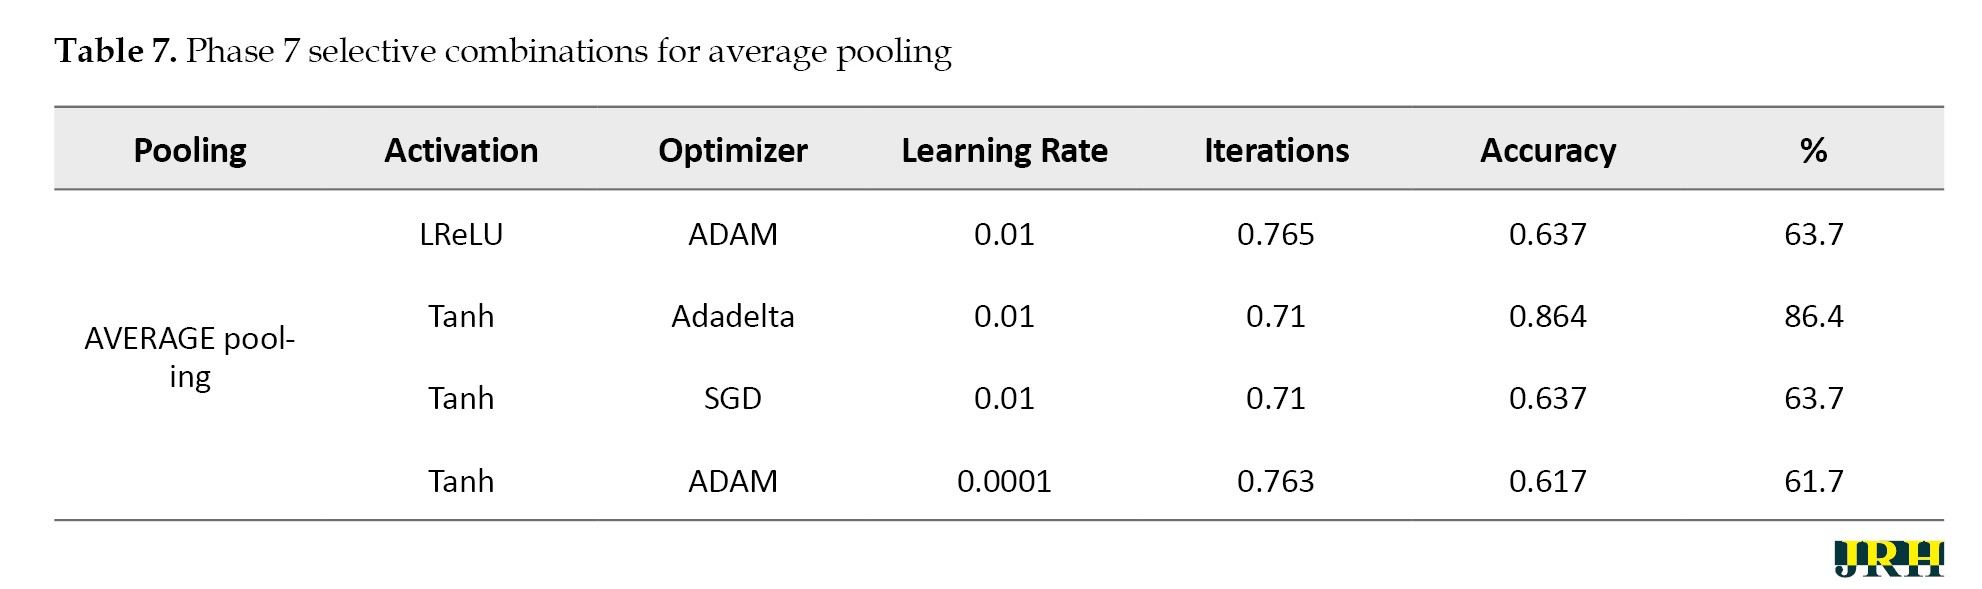
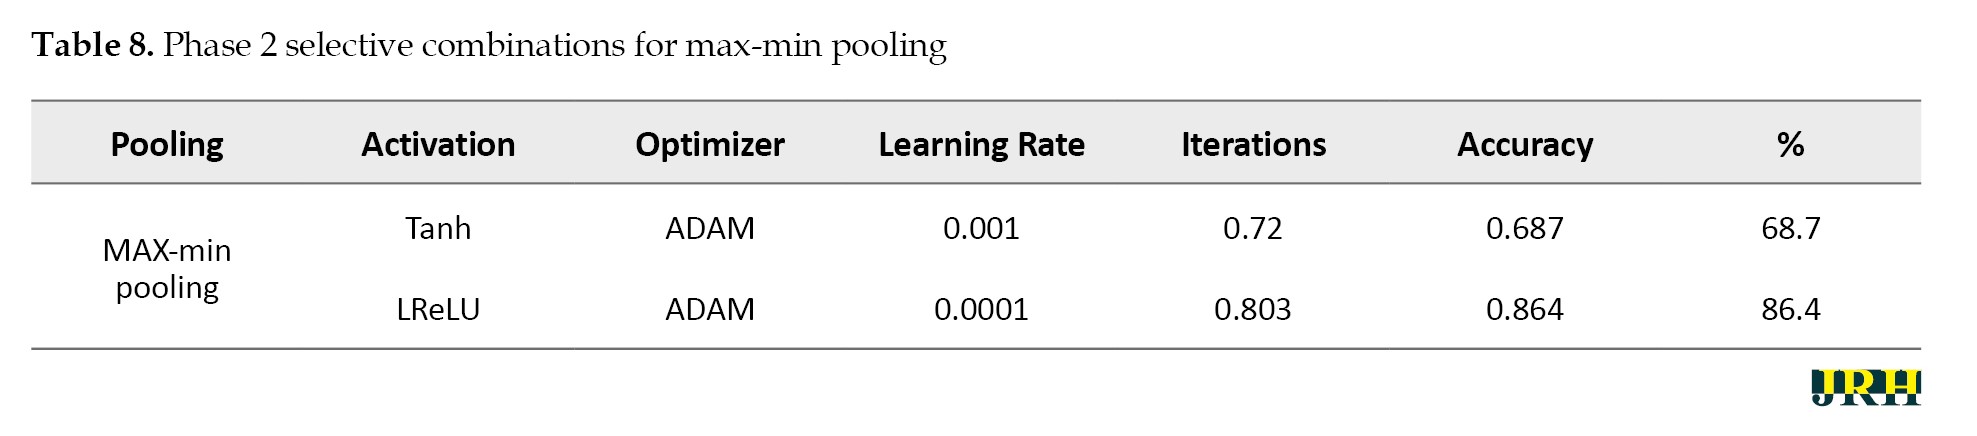
Phase 2: Using 1,500 iterations, the previously indicated combinations are revisited, and the outcomes are analyzed. The results for various pooling methods, including max, min, average, and max-min, are shown in Tables 5, 6, 7, and 8, which compare the accuracy calculated using 1,500 iterations to that calculated using fewer than 100 iterations.
Phase 3: Max pooling, average pooling, and max-min pooling are the three combinations of pooling techniques that work best for this model and dataset. To develop a more suitable model with higher accuracy values, these combinations as mentioned in Table 9, can also be used in conjunction with hybridization or optimization techniques.
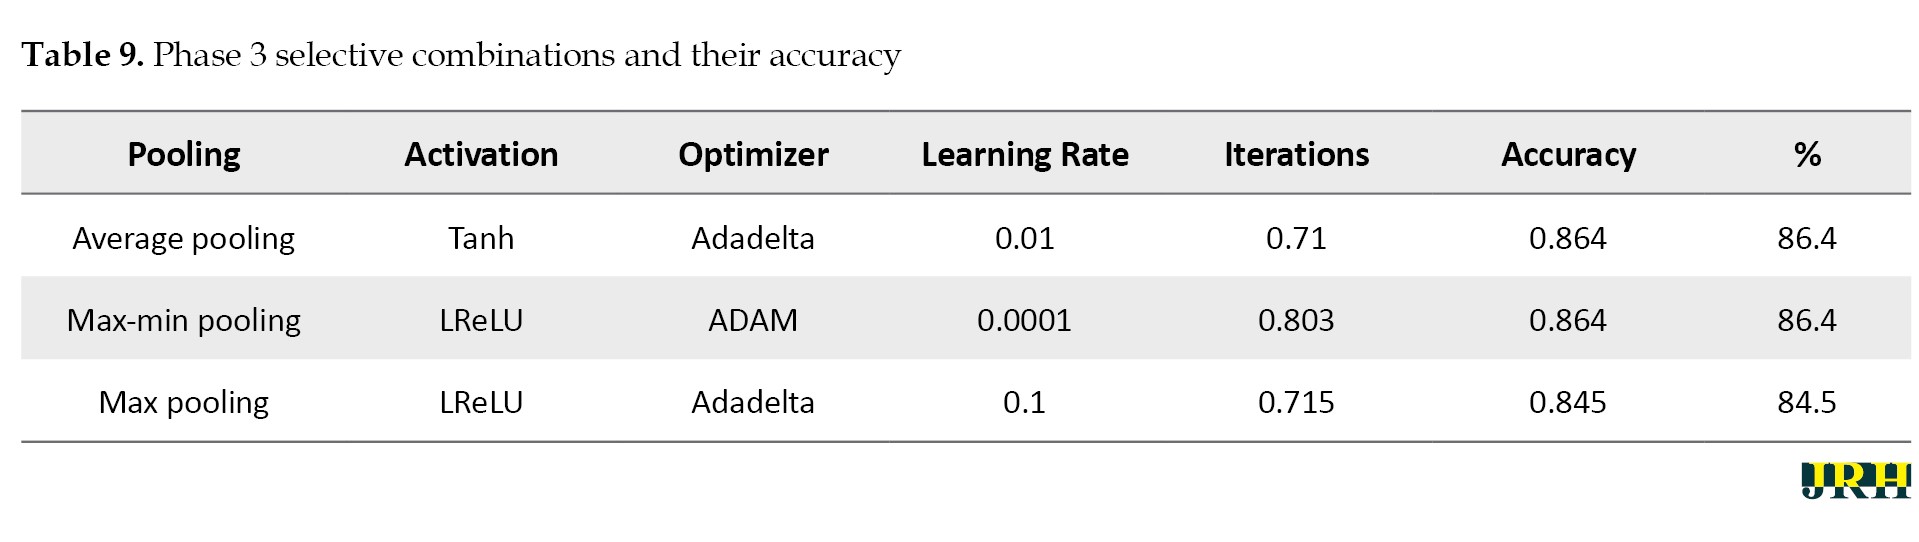
Table 10 presents a quantitative comparison of our proposed system with other methods, demonstrating that our method outperforms the other algorithms even when dealing with large datasets.
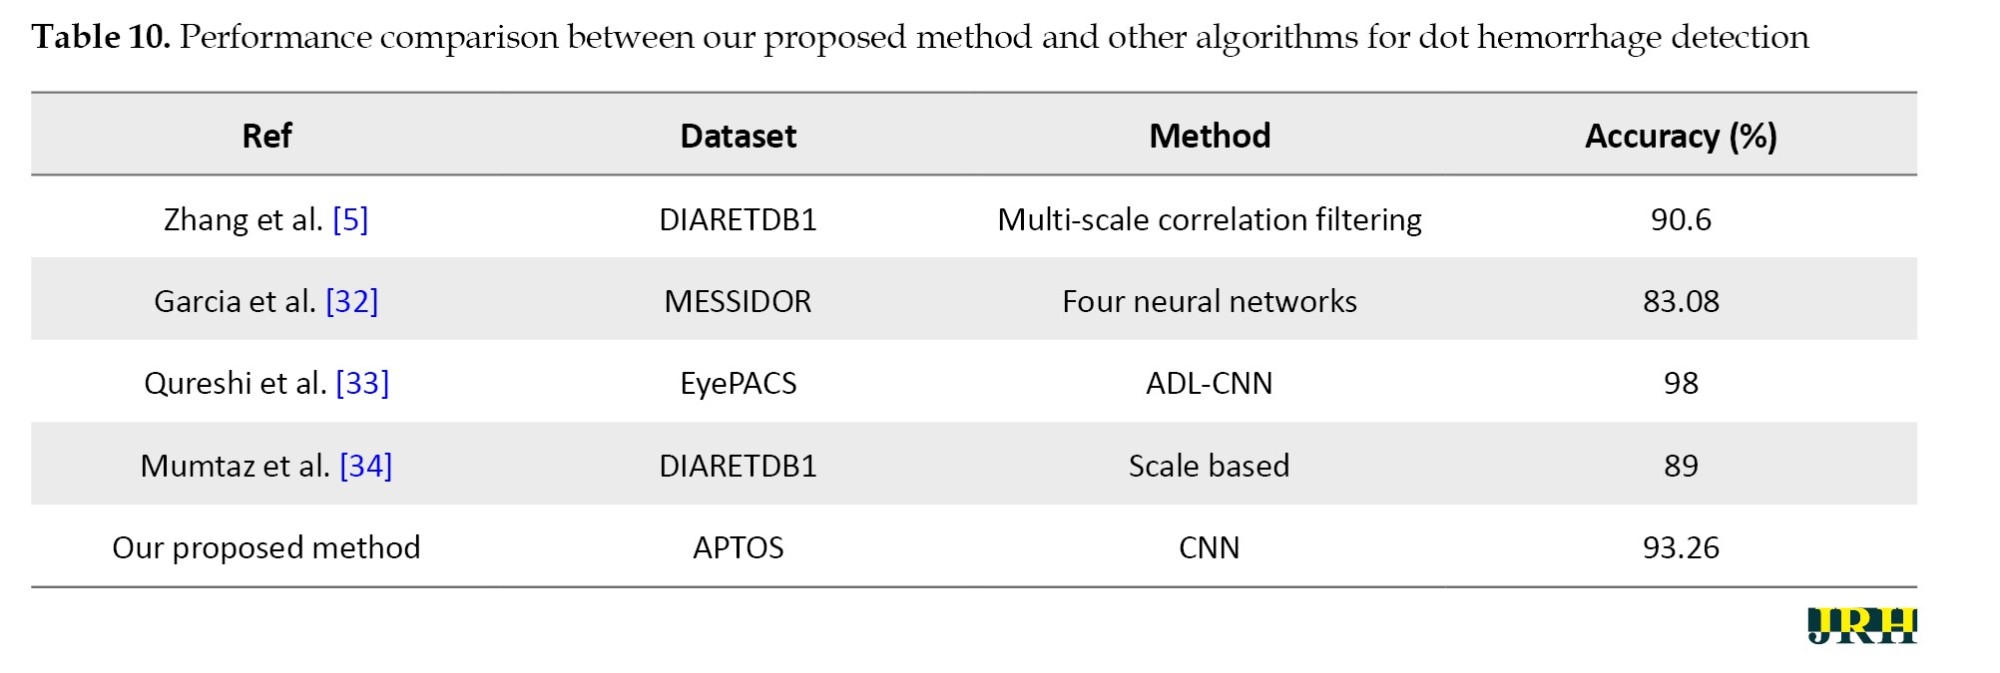
With an average accuracy of 93.26±0.48% and a 95% CI; 92.66%, 93.86%, the proposed model demonstrated reliable performance over several runs.
The accuracy determined using 1500 iterations is contrasted with that obtained from fewer than 100 iterations. It is evident that certain accuracy values increase as the number of iterations grows. The three pooling technique combinations selected for this model and dataset are max pooling, average pooling, and max-min pooling.
Outcomes
The proposed research used CNN image classification, with the leaky rectified linear unit (LReLu) turned out to be the most efficient activation function; tanh function and rectified linear unit (ReLU) also performed well in certain combinations.
Adaptive moment estimation (Adam-50%) and adaptive delta (Adadelta-40%) optimizers provided good accuracy values in CNN cases.
The results from the CNN show learning rates of 0.0001 and 0.001, respectively, which produce better accuracy.
To facilitate effective training, a batch size of 32 was employed. The model was trained over 50 epochs to allow for convergence without overfitting. A dropout rate of 0.5 was used to randomly deactivate neurons during training to enhance generalization.
This research employed a total of 5590 retinal fundus images. The dataset was split into three categories: 65% for training (3662 images), 15% for validation (811 images), and 20% for testing (1117 images). This division was done to guarantee balanced representation and accurate model evaluation.
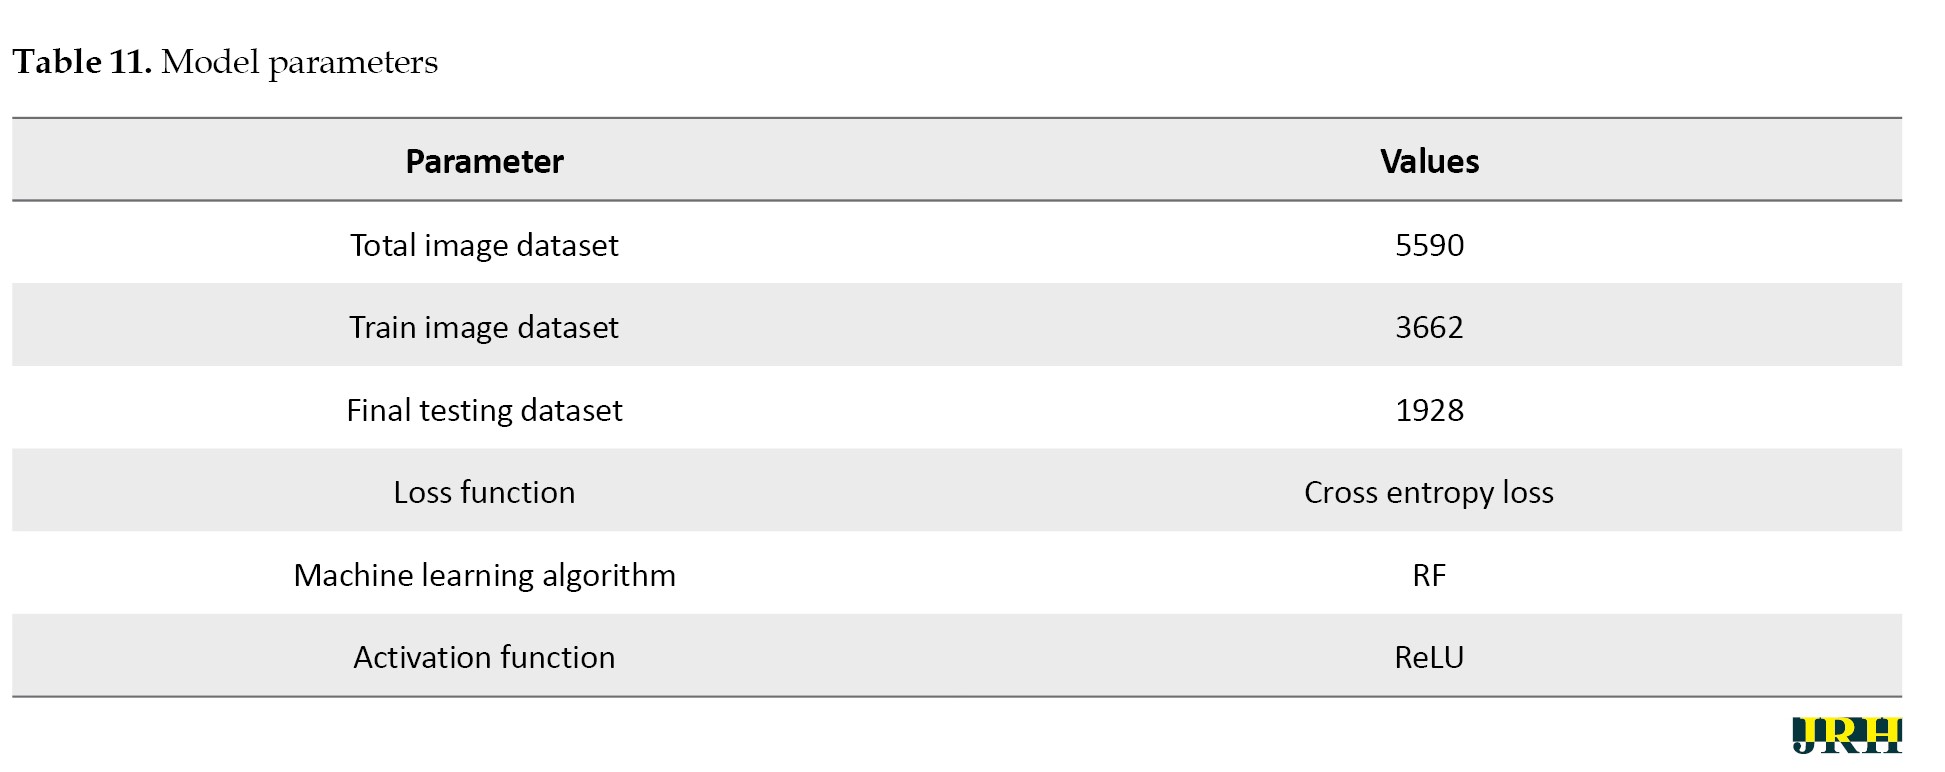
Several pre-processing techniques, such as scaling, contrast enhancement, and noise reduction, were applied to the images before training in order to enhance the visibility of retinal characteristics, like hemorrhages and micro-aneurysms. In order to preserve consistent pixel intensity across samples, data normalization was used. To reduce overfitting and enhance model generalization, data augmentation methods, including rotation, flipping, and scaling, were applied to the training set. To guarantee equitable learning across all severity levels, the dataset was thoroughly analyzed for class imbalance. When imbalances were found, strategies, such as class-weight correction and oversampling of minority classes were used. To achieve the best results, the RF algorithm was used as the main classifier, with the cross entropy loss function and ReLU activation being used as activation methods to improve nonlinear feature learning and guarantee effective gradient flow during model training. The suggested DL model for bleeding detection improved accuracy for the datasets and parameters as shown in Table 11.
Hardware configuration
Processor: Intel Core i5; 11th Generation @ 2.40 GHz, GPU: NVIDIA GeForce GTX 1650 (4 GB VRAM); RAM: 8 GB DDR4.
Operating system: Windows 10 (64-bit). Deep learning framework: Tensor flow 2.10 with Keras. Training time: Approximately 70–80 seconds per epoch, with a total training duration of about 1 hour for 50 epochs.
Software tools
An Intel Core i7 processor, 16 GB of RAM, and an NVIDIA GeForce GTX 1660 Ti GPU running Windows 10 (64-bit) were used. Python 3.8 was used to develop the proposed model, which included DL and ML libraries for image preprocessing, feature extraction, and classification, including TensorFlow, Keras, scikit-learn, OpenCV, and NumPy.
Classification of DR using ML
The different stages of eye disease were classified using several ML algorithms, such as LR, SVM, and RF to detect and categorize DH, as shown in Figure 14.
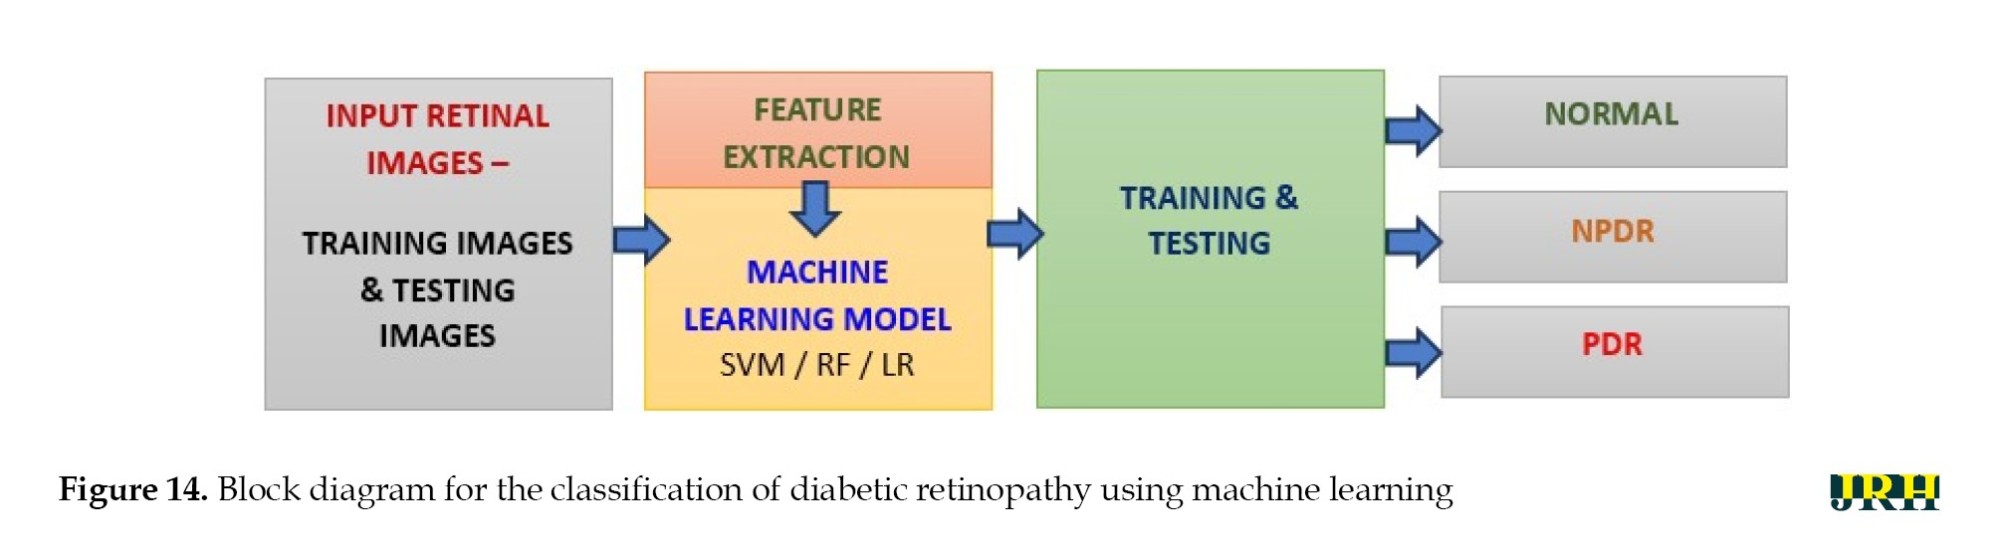 The objectives of this work were hemorrhage detection and classification of the findings into three groups: Normal, NPDR, and PDR.
Hemorrhage detection
The detection scheme for hemorrhage consisted of four stages:
Digitalization of image, hemorrhage detection, false positive in blood vessel elimination technique, feature analysis.
Fundus images used in ophthalmology to visualize the retina frequently exhibited hue shifts due to the flash light. Brightness correction balanced the intensity across the image, whereas gamma correction adjusted the image contrast in a nonlinear manner (0.5 to 3), increasing specific details for examination in fundus imaging.
Histogram stretching remapped the intensity values of pixels, bringing the lowest value closer to 0 (black) and the maximum value closer to 255 (white). When the green channel was employed solely for fundus image feature extraction, an RGB retinal image gained contrast. To make the relevant features stand out against the background, adaptive histogram equalization was applied. A 3×3 median filter was used to reduce random noise in the images.
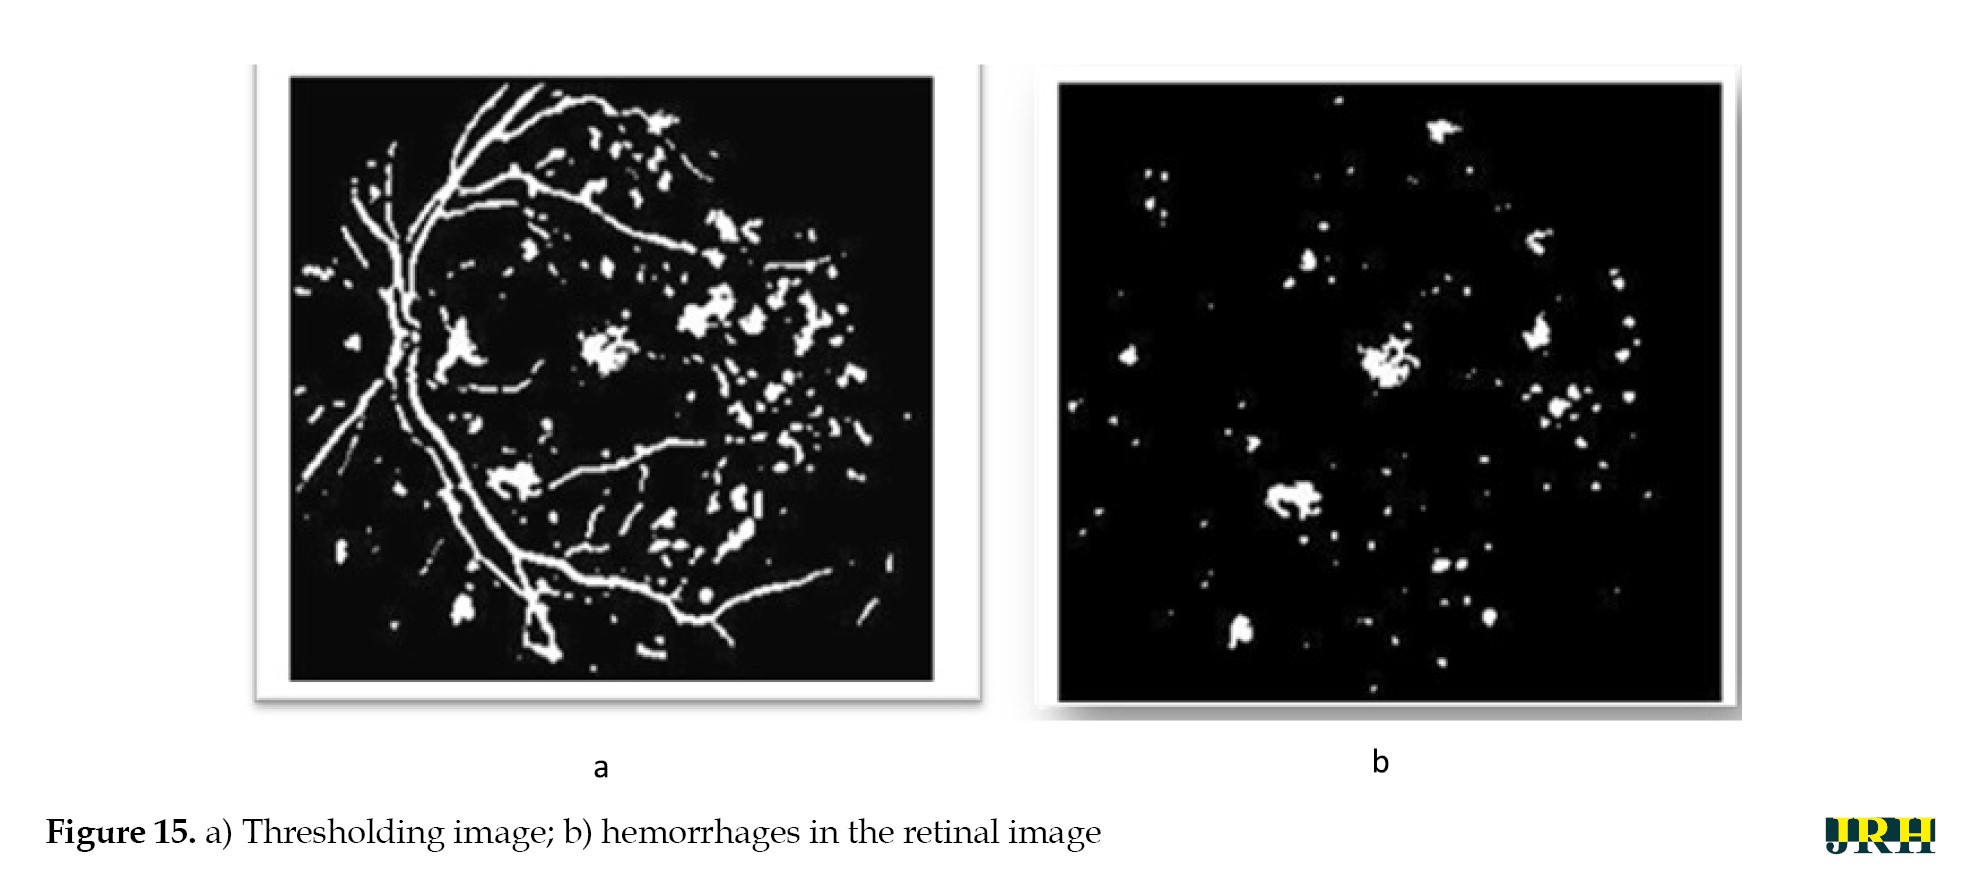
The bounding box technique was used to reduce false positive blood vessels. The ratio of each segment’s main axis length to minor axis length was computed, and those with greater values (>1.57) were removed. The hemorrhages were identified, and their density was determined by counting the number of white pixels in the images, as shown in Figure 15.
 DH is classified into distinct types utilizing ML methods, like as RF, LR, and SVM. Among these, the RF model has the highest accuracy compared to the others, scoring 92.2% accuracy, as mentioned in Table 12.
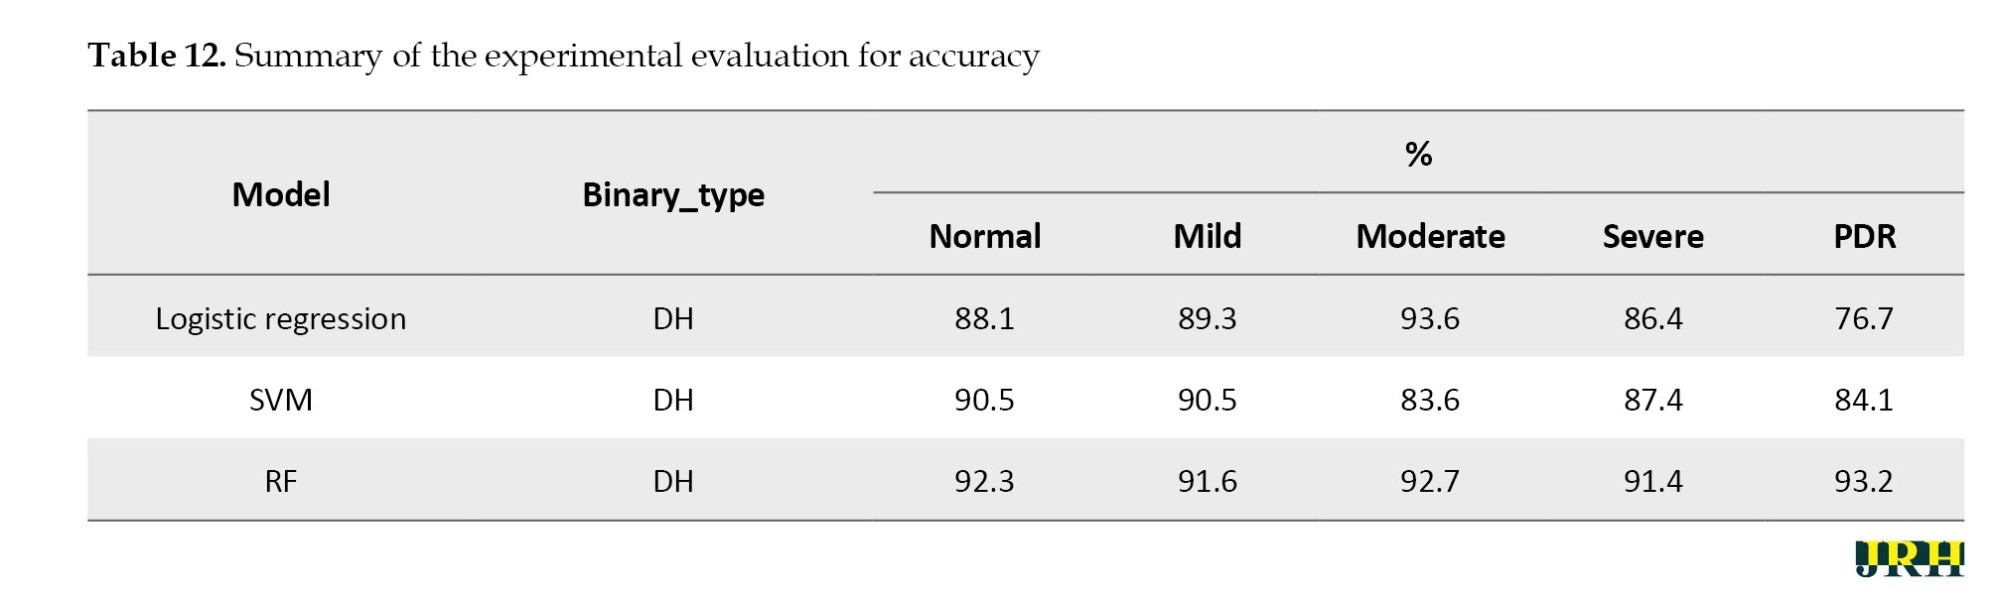
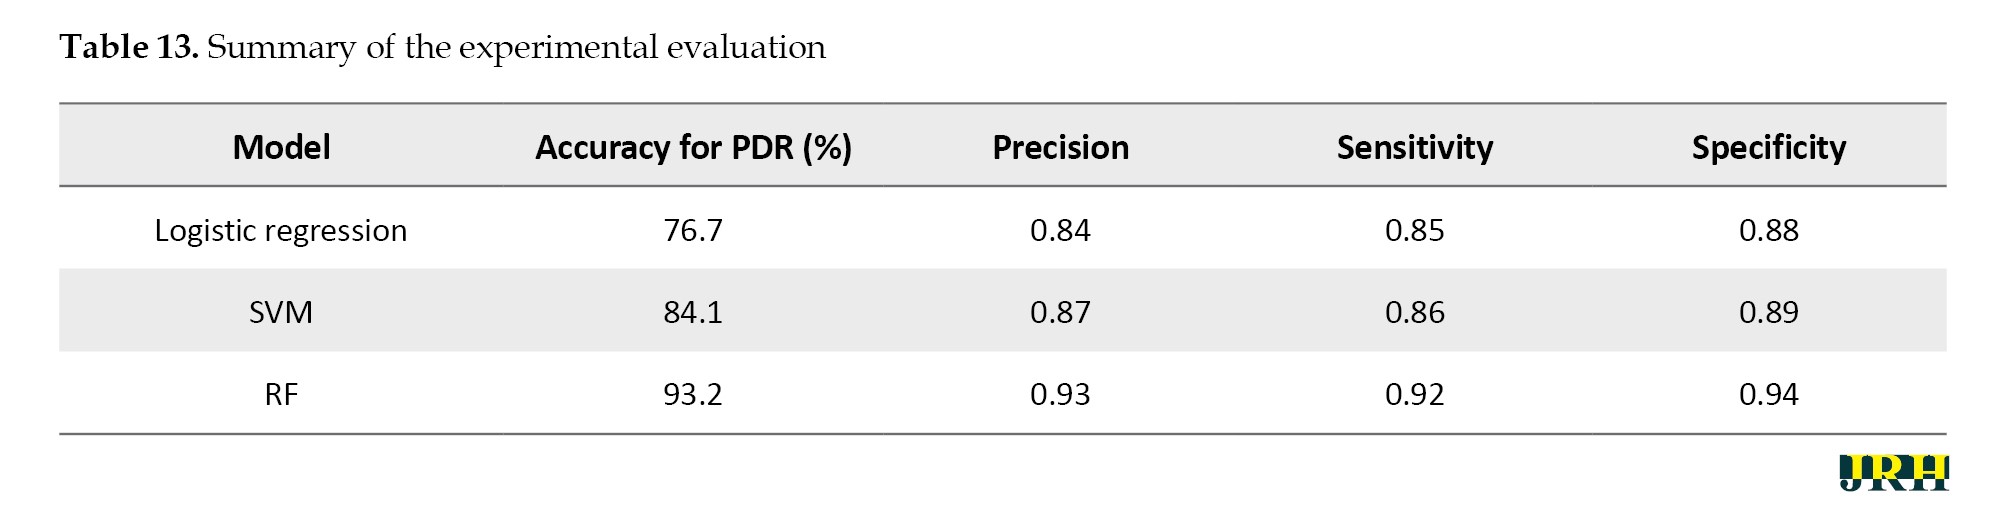
The RF model performed best among all the classifiers assessed, successfully diagnosing PDR with an accuracy of 93.2%, precision of 0.93, sensitivity of 0.92, and specificity of 0.94. In comparison, the SVM and logistic regression models achieved accuracies of 84.1% and 76.7%, respectively. Because RF is an ensemble model that successfully decreases variance and overfitting and can capture complex non-linear interactions, it outperformed the other models. Our findings suggest that random forest (RF) offers a more reliable and flexible framework for the classification of DR, as shown in Table 13.
In Table 14, the mean accuracy, standard deviation, and 95% CI were used to assess the performance metrics of three classifiers: RF, SVM, and LR.
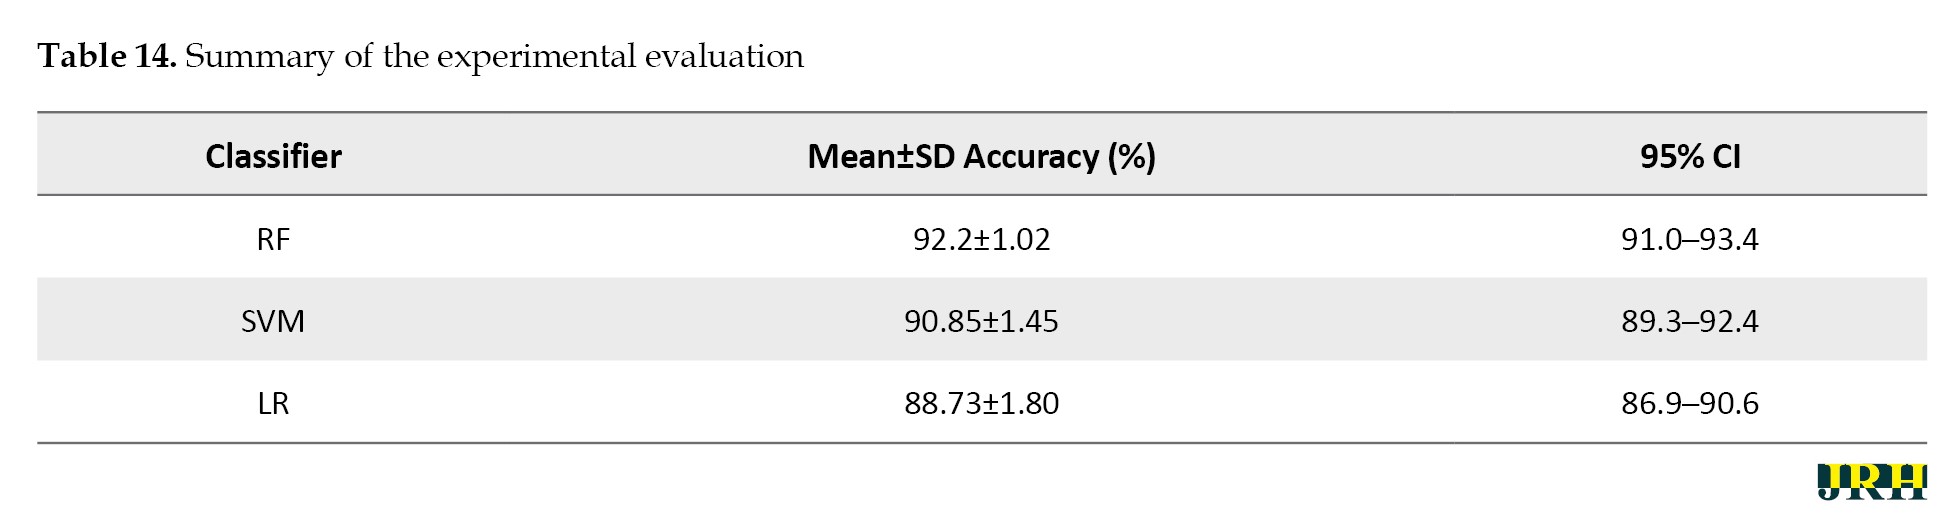
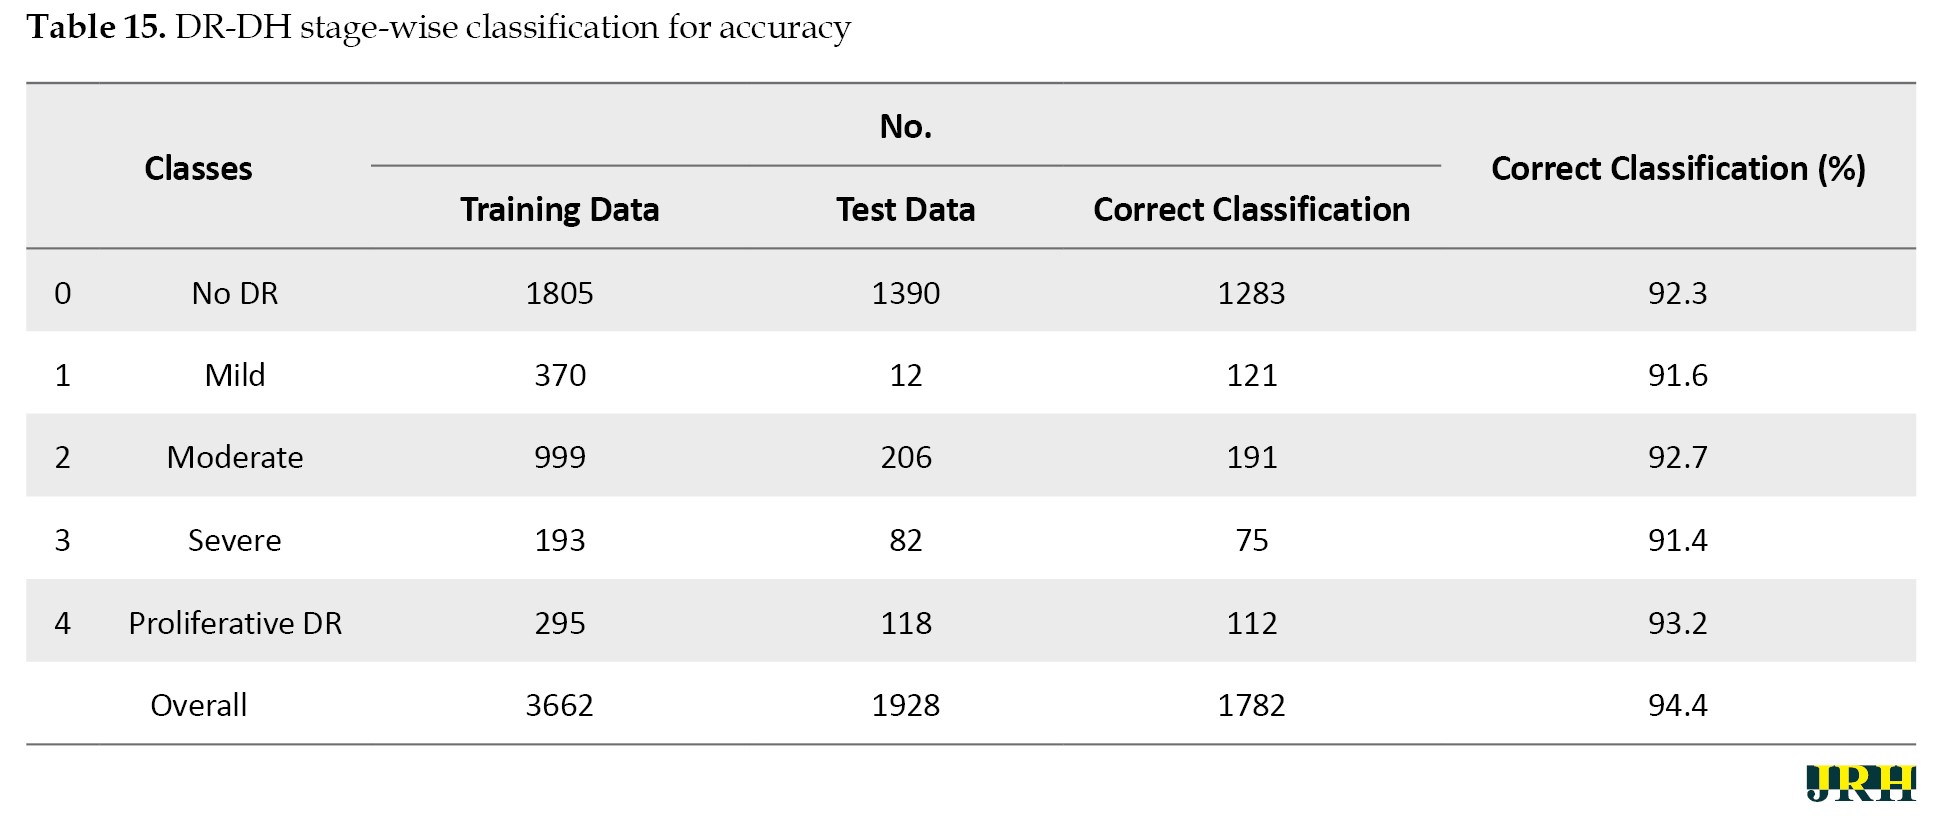
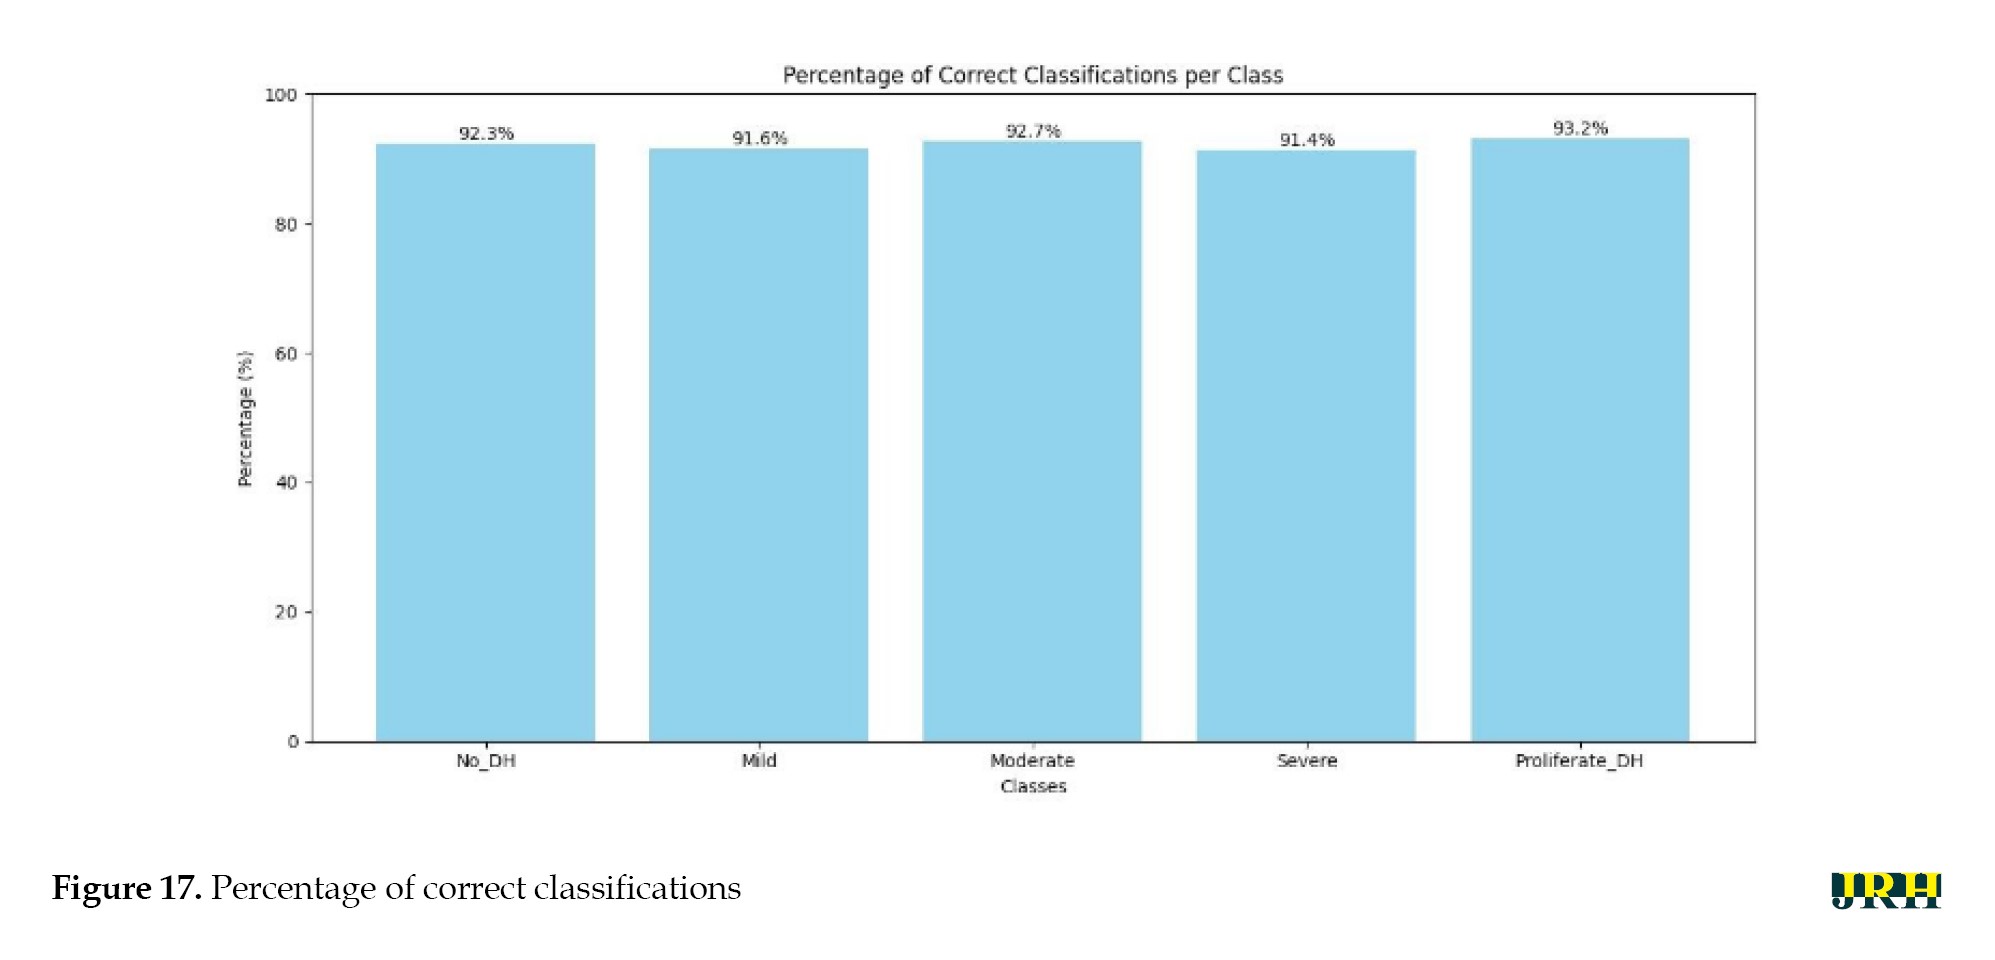
In comparison to the other techniques, the RF classifier demonstrated the highest mean accuracy (93.2%) with the least amount of fluctuation, demonstrating the stability and durability of the model. The Table 15 represents the classes over the available dataset to classify the percentage of correct classification.
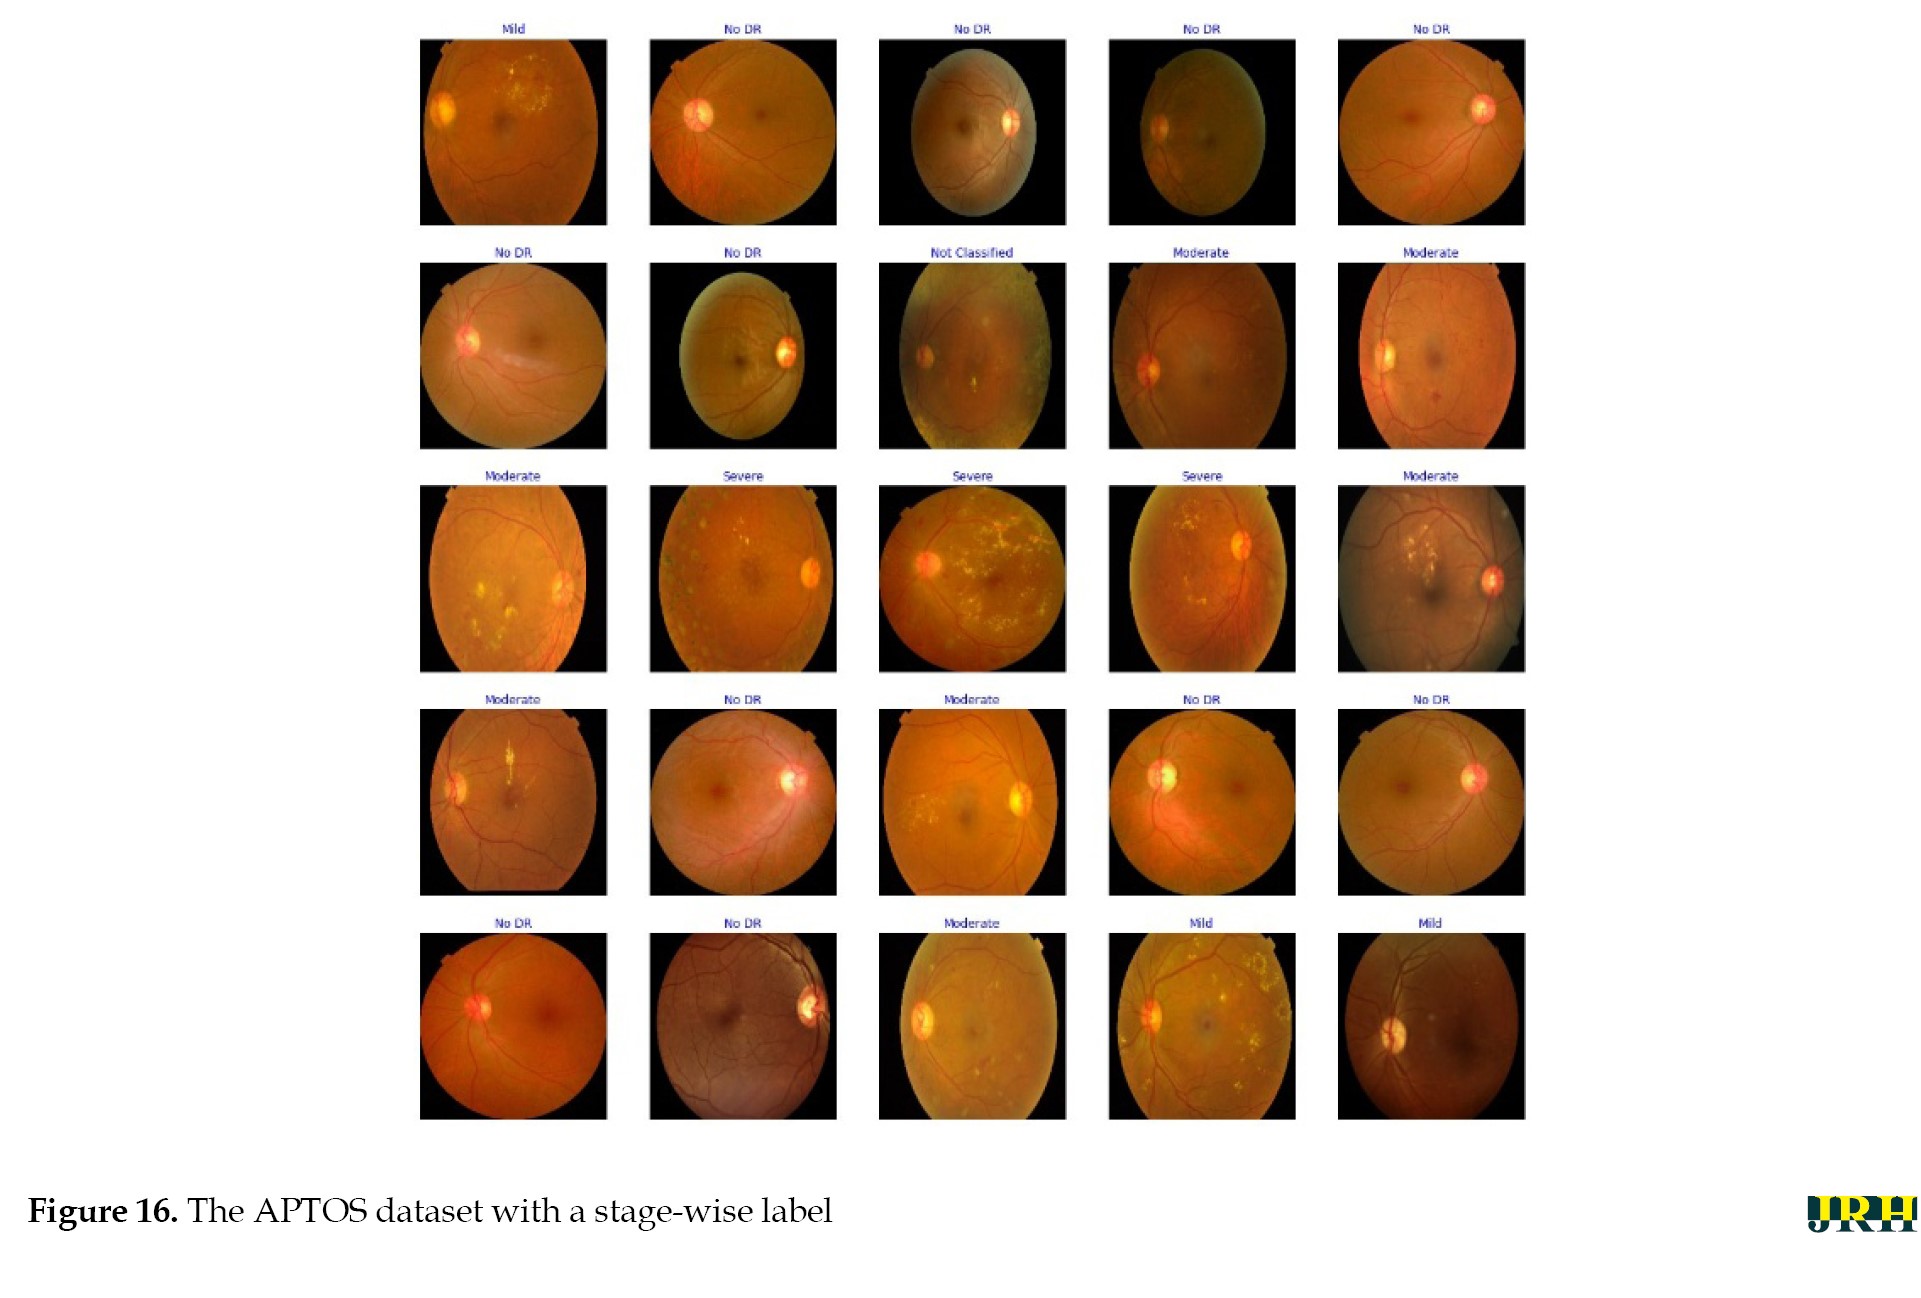
Stage-by-stage sample images from the APTOS dataset are displayed in the Figure 16.
Discussion
The percentage of correct classifications across different stages is shown in Figure 17, which displays the validation of test images by contrasting the actual input images with the anticipated output images.
 The accuracy of training versus validation is shown in Figure 18.
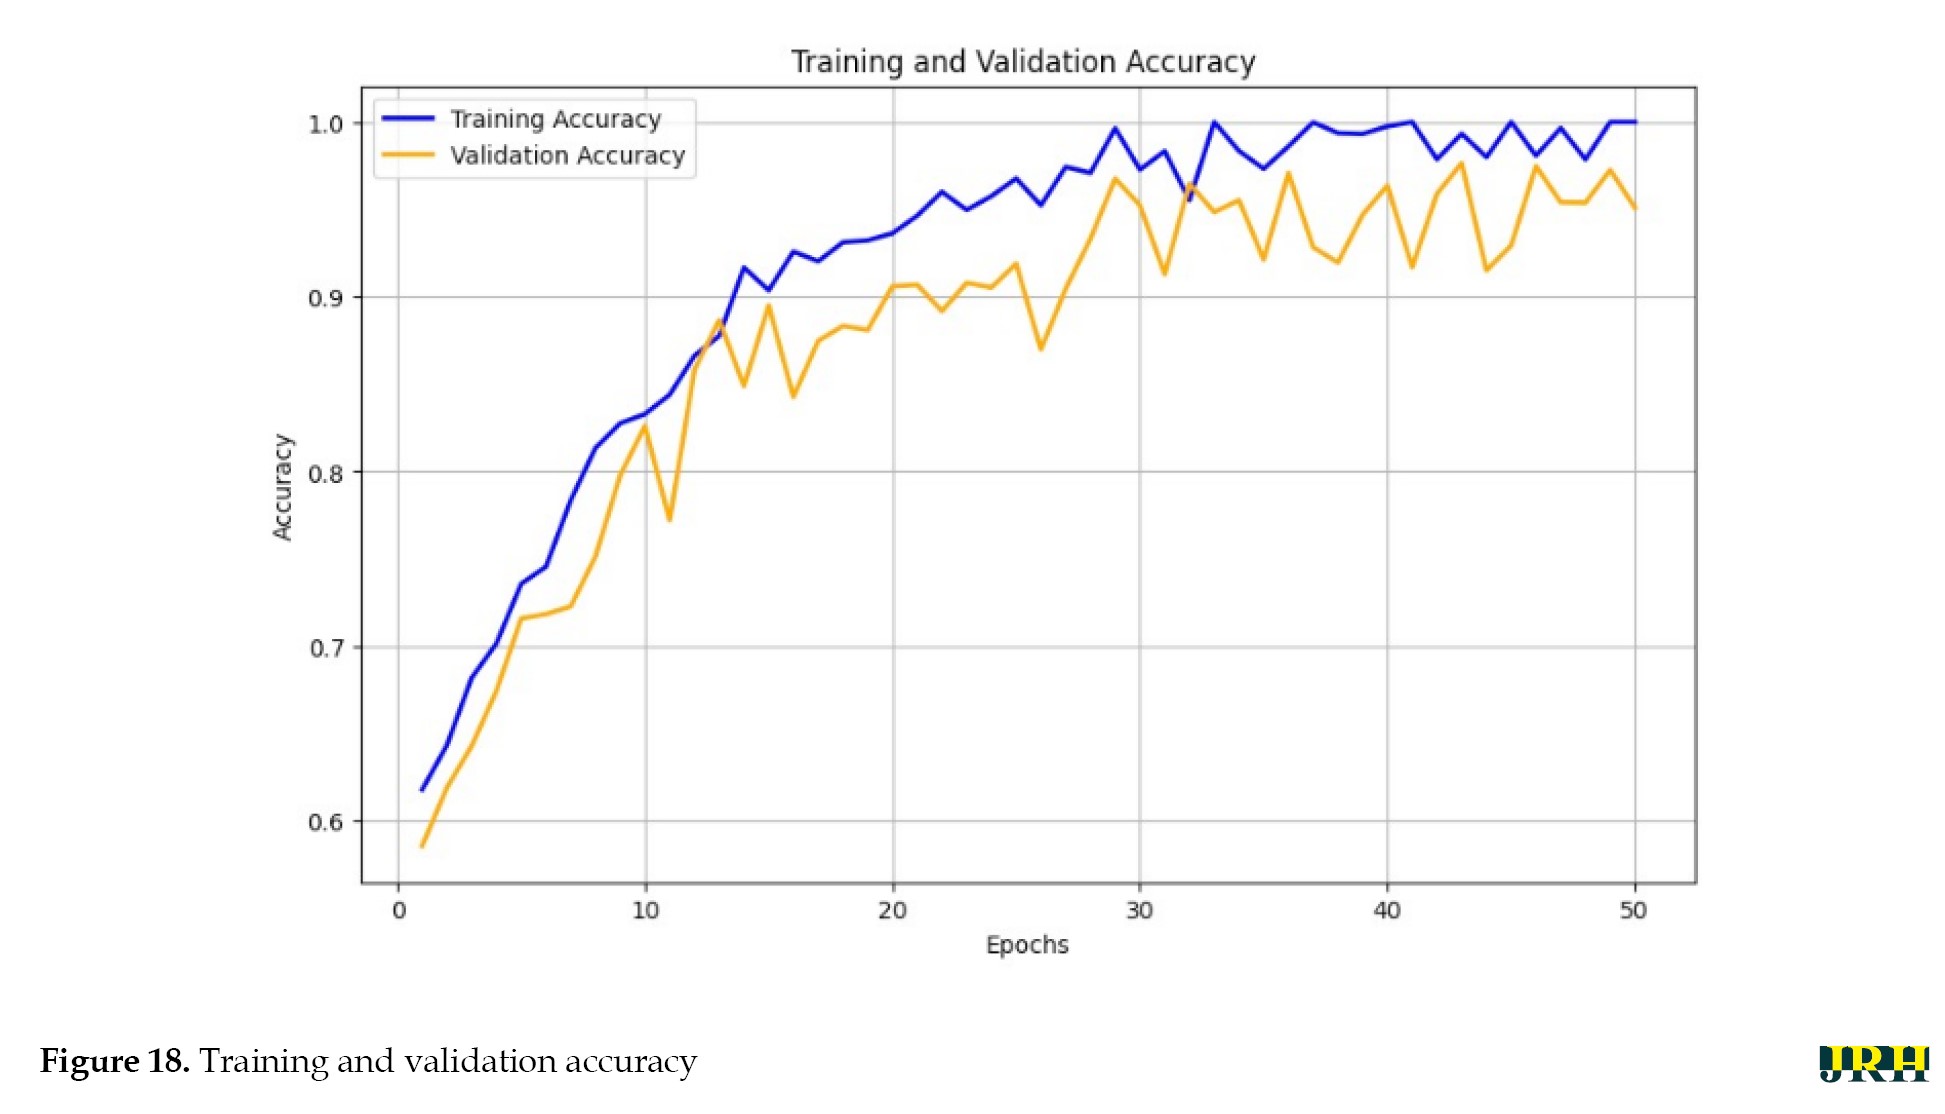 As the number of epochs rises, so does the accuracy. The accuracy curves for training and validation at 50 epochs demonstrate consistent growth for both datasets, suggesting that the model learns effectively and performs well with minimal overfitting.
The training versus validation loss is shown in Figure 19.
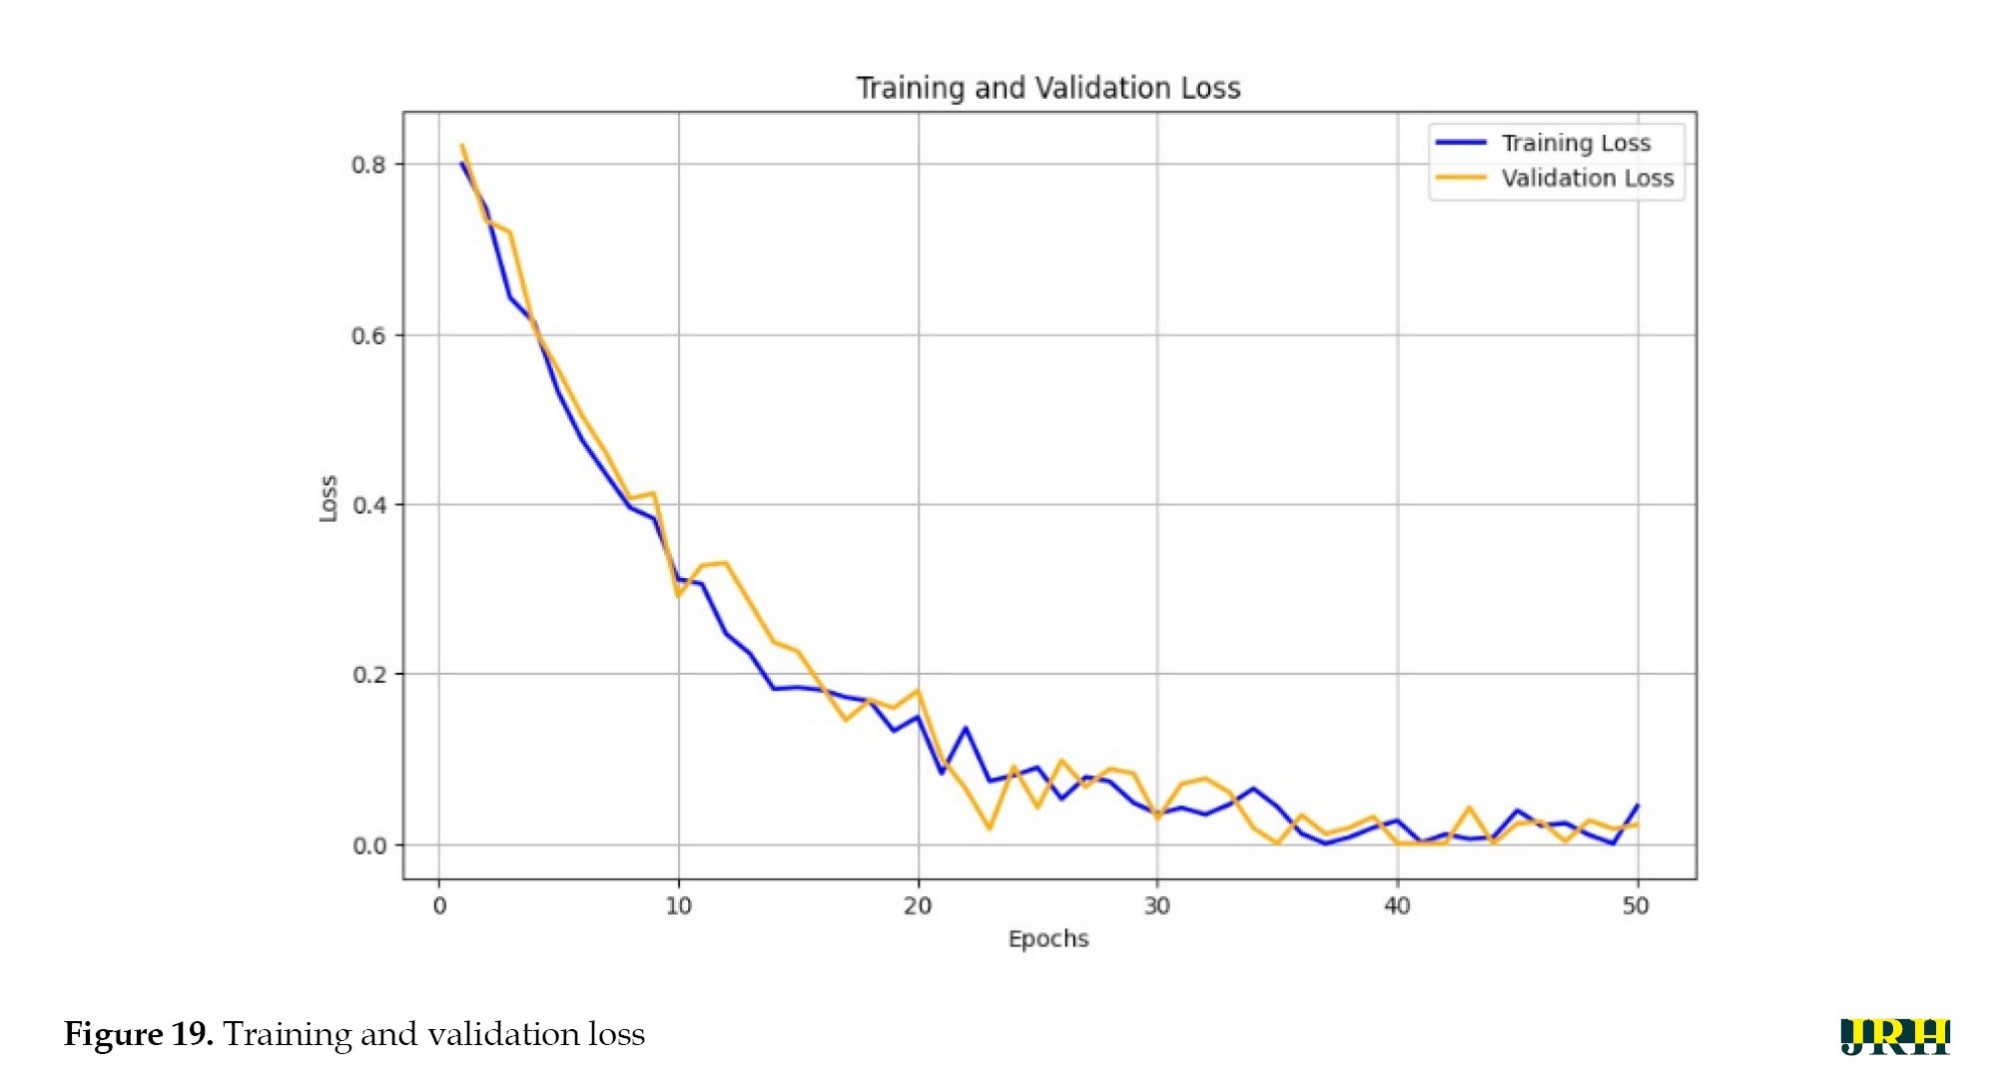 The loss curves for training and validation at 50 epochs exhibited a steady decline in both losses, indicating effective learning and good generalization of the model without severe overfitting.
A model’s performance over several thresholds is graphically represented by the receiver operating characteristic curve (ROC). The true positive rate (TPR) and false positive rate (FPR) are computed for every threshold or at particular intervals, and the TPR is plotted against the FPR for all, as illustrated in Figure 20.
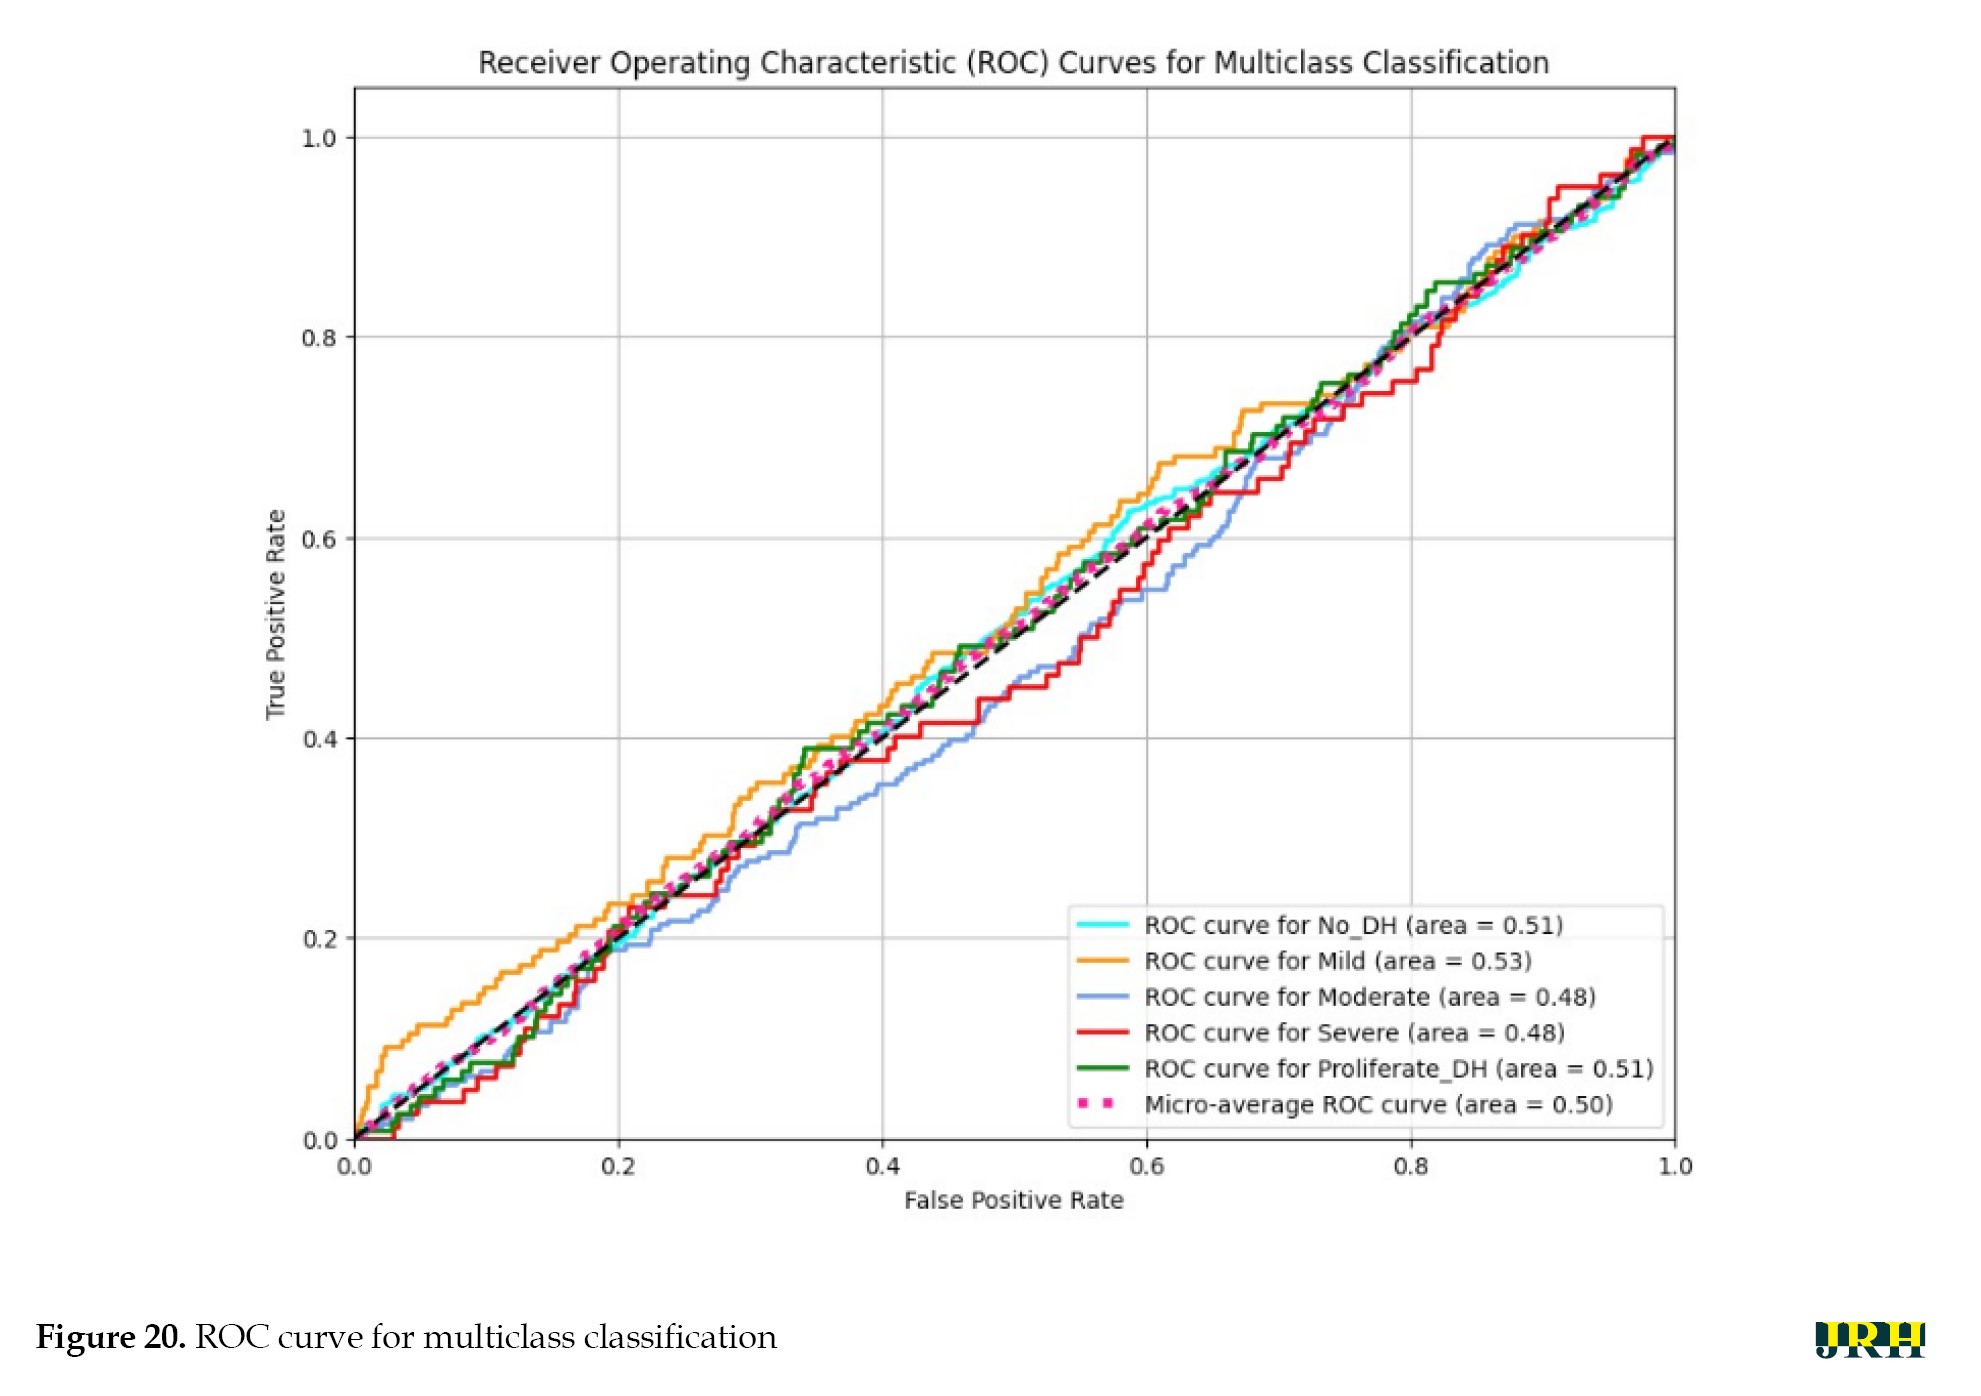 In an ideal model, this would appear on the graph as a single point at coordinates (0, 1), with a TPR of 1.0 and an FPR of 0.0.
Varying illumination, image quality, and lesion size across samples may have contributed to inconsistent feature representations. Future research could implement deep feature extraction techniques, ensemble learning approaches, or class-specific data augmentation strategies to improve class separability and overall ROC performance.
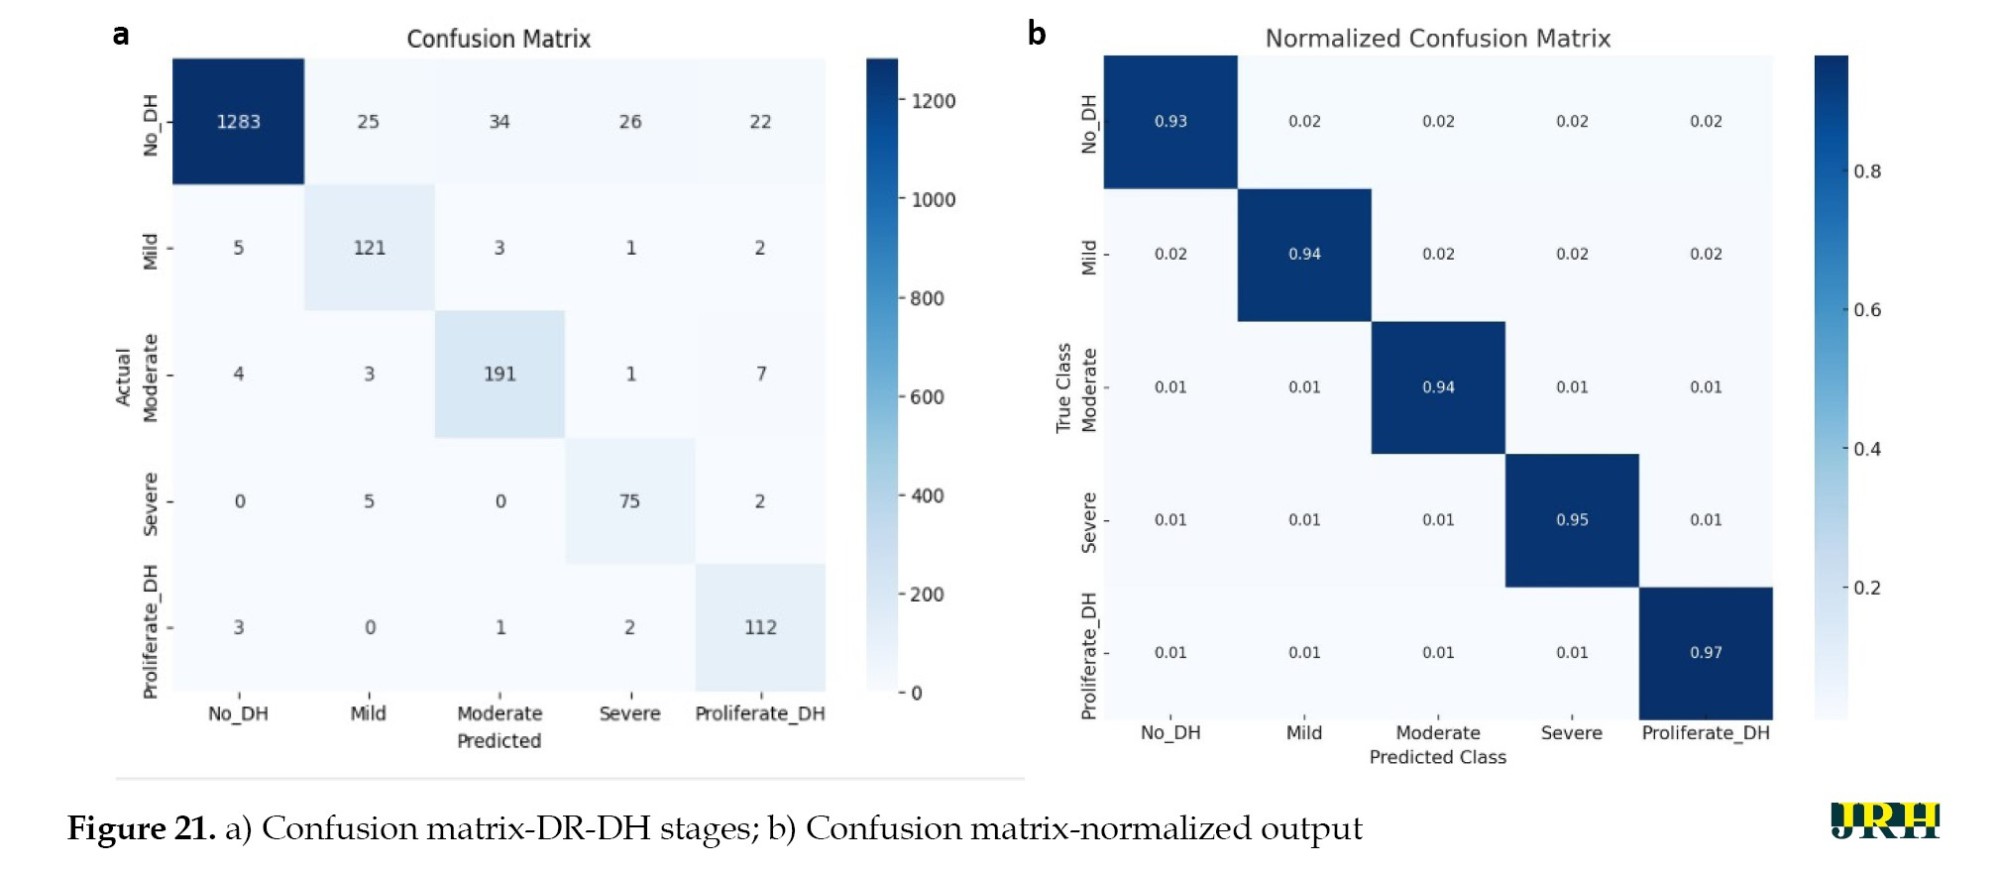
As shown in Figure 21a and b, the confusion matrix for the APTOS datasets further demonstrated the performance of our suggested method by highlighting the precise prediction of different DR stages.
 DR DH was classified using ML algorithms, such as RF, LR, and SVM in Tables 12, 13 and 14. Compared to the other models, the RF model exhibited the highest accuracy. The accuracy of the suggested model was 93.2%, with a corresponding loss of 18.4%.
Conclusion
A VGG16-based CNN model can detect retinal hemorrhages from the APTOS dataset with an impressive accuracy of 93.26%. The experimental results showed that the Leaky ReLU activation function improves model performance for image classification, whereas the Adam and Adadelta optimizers consistently outperform CNN-based learning. Furthermore, conventional ML models, such as RF, SSM, and LR were successfully used to classify multi-stage DR, achieving an accuracy of 92.4% in recognizing dynamic imaging DHs. The findings can be further expanded using new DL architectures, like vision transformers (ViT) or hybrid CNN-Transformer networks, which provide better global context and feature extraction for subtle lesion identification. Self-supervised learning applied to large-scale unlabelled retinal datasets can increase model generalization and eliminate the need for manual labelling. The future scope of the research can be extended by enhancing model interpretability through the use of explainable AI (XAI) techniques, which would foster clinical trust and enable ophthalmologists to understand the reasoning behind predictions. Enhancing clinical applications and diagnostic interpretability will require integrating multimodal data fusion (fundus and OCT images), explainable AI algorithms, and uncertainty quantification. The clinical use of the suggested automated detection method in DR screening programs appears to have a promising future. The system’s ability to automatically identify early-stage DH lesions in retinal fundus images can help ophthalmologists prioritize high-risk patients, enabling prompt diagnosis and treatment. This method not only reduces the workload for medical professionals but also makes screening more accessible in settings with limited resources or in primary healthcare. Furthermore, improving the model for real-time or edge deployment will make scalable screening solutions possible in remote and resource-constrained settings. Together, these advancements have the potential to result in a more robust, generalizable, and clinically reliable system for automated DR diagnosis and grading.
Limitations of the study
The current study has significant limitations, even though it shows encouraging findings in the automated detection of DH for the early diagnosis of DR. First, the APTOS dataset was used for the experimental evaluation, which would restrict the model’s applicability to other datasets or clinical situations with various imaging conditions, camera settings, and demographic variety. Second, the research mostly concentrated on identifying a single lesion type, DH, without taking into account additional pathological characteristics that are necessary for thorough DR grading, such as microaneurysms, exudates, and neovascularization. Additionally, the model’s reliability and diagnostic capability have not been verified in extensive prospective trials or real-world clinical settings. Investigating the potential application of this strategy in actual clinical workflows would be beneficial for future research. The model might be used, for example, as a decision-support tool to assist ophthalmologists with patient triage, early identification, and large-scale DR screening. This would alleviate the diagnostic burden and promote teleophthalmology-based screening in environments with limited resources.
Ethical Considerations
Compliance with ethical guidelines
There were no ethical considerations to be considered in this research.
Funding
This research did not receive any grant from funding agencies in the public, commercial, or non-profit sectors.
Authors' contributions
All authors contributed equally to the conception and design of the study, data collection and analysis, interpretation of the results, and drafting of the manuscript. Each author approved the final version of the manuscript for submission.
Conflict of interest
The authors declared no conflicts of interest.
Acknowledgments
The authors express their gratitude to the APTOS dataset providers for making the information utilized in this study publicly available.
References
Diabetes is a prevalent and serious chronic disease with long-term consequences. It occurs when blood sugar or glucose levels become too high. Insulin is a hormone that transports blood glucose into bodily cells. Diabetes occurs when the pancreas fails to produce enough insulin or the body cannot use it properly. Excess hyperglycemia in the bloodstream can harm several physiological systems. Diabetes can cause both macrovascular (big blood vessels) and microvascular (small blood vessels) complications, including retinopathy, nephropathy, neuropathy, heart attacks, strokes, and inadequate blood supply to the legs. Diabetic retinopathy (DR) is the abnormal development of blood vessels in the retina caused by diabetes, leading to vitreous hemorrhages. DR can cause deformities, such as microaneurysms, hemorrhages, and hard and soft exudates (cotton wool patches). The global diabetes overview for 2023 indicates a diabetic population of 537 million International Diabetes Federation (IDF), with a predicted increase to 783 million by 2045. Additionally, there are annual deaths of 1.5 million World Health Organization (WHO).
The main objective of this work was to develop an automated approach for DR detection. We aimed at developing a deep learning (DL) approach for correctly detecting and classifying DR existence and severity levels. DR affects one-third of all diabetic people. An accurate diagnosis at an early stage can lessen the risk of vision loss. The current approaches are effective but require substantial resources. Advancements in AI assist in the diagnostic process by enabling automated image analysis to help specialists detect early indicators of DR. All individuals with diabetes should have their eyes checked at least once a year. The proposed research aims to investigate changes in the ocular vascular system as diabetes progresses, utilizing computational vision, machine learning (ML), convolutional neural networks (CNN), and other DL approaches to screen for detection and classification of DR. When used in clinical diagnostic settings, this technology can save time and provide accurate results more efficiently, benefiting both patients and medical practitioners.
Literature survey
For DR classification, an ANN classifier employing Bayesian regularization and resilient backpropagation techniques yields the best results in terms of sensitivity and precision [1]. CNN is used for feature extraction, selection, and classification. The automatic screening method created by Gharaibeh et al. yielded a 98.4% accuracy rate in DR classification following a series of earlier processing techniques. Entropy images are created from retinal images in order to improve categorization. The intricacy of the original fundus images can be determined by quantifying the image information. Using DL for categorization increases accuracy from 81.8% to 86.0% when standard fundus images are employed [2].
Automatic DR identification using CNN, ResNet50, and InceptionV3 achieved a noteworthy 96.18% accuracy over 80 epochs [3]. For DR classification, VGG-19, a visual geometry group network (VGG Net), employs preprocessing tasks. This classification technique segments regions using a Gaussian mixture and selects features using singular value decomposition. With a 98.34% accuracy in DL-based segmentation, feature extraction, feature selection, and classification, the proposed model is reported to produce superior outcomes [4]. In a different experiment, Zhang et al. used ensemble learning and transfer learning in the DL model to categorize DR images. Following pre-processing techniques, like image normalization and histogram equalization, data augmentation is used. The model achieved an average accuracy of 96.50% [5]. Shanthi et al. used an AlexNet CNN as a pre-processing technique for classification of DR in fundus imaged based on green channel extraction [6].
The Synergic DL approach proposed by Kathiresan et al. produced accurate classifications of DR in fundus images. When preprocessing and segmentation are performed prior to classification, the DL model outperforms many other models currently in use [7]. Gayathri et al. identified DR using multiple ML classifiers and achieved remarkably good results after using CNN to extract the features from a unique study. In this experiment, the CNN proves to be an excellent classifier when multiple classifiers are integrated [8]. In a different experiment, a multi-scale shallow CNN is merged. Each CNN acts as a fundamental learner, facilitating feature extraction from various vision-related perceptual domains, and the integration of the networks is used to establish the final classification. It is evident that this integrated approach performs better than other state-of-the-art models. When additional image enhancement techniques, like unsharp masking (UM) and histogram equalization are applied, the model performs better [9]. In the study by Pao et al. UM is used to evaluate the fundus image preprocessing and the Gray level fundus image entropy. Using both image types for categorization in a bi-channel CNN yields better results [10]. In order to classify an image, it must be selected from a predefined set of categories, for which numerous techniques have been developed.
ML is a technology that is frequently used in many different fields. ML techniques are applied to fundus images in order to classify DR. A three-stage classification technique is used to distinguish between DR and non-DR images. AdaBoost, K-nearest neighbor (KNN), SVM, and gaussian mixture model (GMM) are ML approaches that manage the three steps of DR processing: Segmentation, lesion categorization, and severity rating. KNN and GMM have been found to perform well in classification [11]. By classifying DR using the Messidor and DBret datasets, SVM and KNN are used to identify retinal microaneurysms, with SVM performing better than KNN [12]. In terms of DR prediction, SVM outperforms decision trees and logistic regression [13]. After pre-processing and segmentation, SVM is used to classify DR into three classes: Normal, mild, and severe [14]. The Naive Bayes classifier outperforms SVM in a comparison of two ML techniques for classifying DR instances [15]. The author proposed how deep learning models can enhance diagnostic accuracy by automatically identifying relevant features in medical imaging data. Compared with various CNN models, VGG-16 outperforms others in detecting the presence of stroke types with higher accuracy [16]. For image classification, three models, like SVM, KNN, and XGBoost are used and SVM outperforms the other two [17]. DR is detected in retinal images using multilayer perceptron neural networks [18]. Optimal path forest (OPF) and restricted boltzmann machines (RBM) models were used to classify retinal images according to the presence or absence of disease-related retinopathy.
For the binary and multiclass categorization of DR, Gayathri et al. proposed an automated methodology [19]. The anisotropic dual-tree complex wavelet transform (ADTCWT) was used to extract features from retinal fundus images. Mujeeb Rahman et al. demonstrated an automated DR screening method utilizing ML techniques [20]. In medical image classification tasks, deep learning models, particularly CNNs, have shown impressive accuracy. Diagnostic performance is further improved by transfer learning with pre-trained architectures, such as VGG and ResNet. In order to improve model generalization, recent developments further highlight the significance of pre-processing methods and data augmentation [21]. The two methods that were employed were DNN and SVM. The three primary procedures that were emphasized in the study were image segmentation, feature extraction, and classification. The combined ML architecture developed by Narayanan et al. aims to diagnose and grade DR. [22]. This effort proposes a theoretical framework to assist doctors in diagnosing patients with brain strokes, utilizing image segmentation to identify brain strokes [23]. The author proposed that artificial intelligence and image processing can be used to detect and classify early-stage DR, allowing for prompt diagnosis by identifying minute retinal anomalies. This method enables effective screening in clinical settings, improves accuracy, and lowers manual errors [24]. Using vascular characteristics as important biomarkers for disease detection, this study proposes a DL pipeline for categorizing retinal vessels to aid in the early prediction of DR and retinal pigmentosa [25]. In order to improve the early detection of retinal dot hemorrhages (DH) and increase the sensitivity and accuracy of detecting the early stages of retinal illness, this study investigated a novel dynamic image comparison technique [26]. The strategy was able to compete with the most advanced deep learning and handmade techniques. Evaluation on the Kaggle APTOS and DIARETDB1 datasets revealed excellent performance, with DIARETDB1 obtaining up to 97% accuracy [27].
The research titled “DR: New concepts of screening, monitoring, and interventions” (2024) [28] highlights both biological insights and technological innovations in screening, monitoring, and treatment. This study on early oxidative, inflammatory, and neurovascular changes in the retina and brain, even during prediabetes, demonstrated that conventional fundus examinations only detect DR at advanced stages. In contrast, advanced imaging modalities such as OCT, OCTA, MSI, and ZNDpA staining, along with functional testing, can reveal earlier pathologies, enabling timely interventions like micropulse laser therapy or topical/nasal antioxidants to preserve retinal function. The review “current research and future strategies for the management of vision-threatening DR” [29] emphasized the importance of global strategies to reduce the burden of vision loss, stressing the role of novel serum and imaging biomarkers, AI-assisted handheld retinal cameras for scalable screening, and the integration of predictive models with electronic medical records to support precision medicine, while noting that anti-VEGF therapy, though standard, remains costly and burdensome.
In another study [30], a modified U-Net was developed for automated haemorrhage segmentation in retinal fundus images (IDRiD, DIARETDB1 datasets), achieving high diagnostic performance with 80% sensitivity, 99.6% specificity, 98.6% accuracy, an IoU of 76.61%, and a Dice score of 86.51%. Complementing this, another study [31] introduced a FastViT-based knowledge distillation framework where EfficientNet-B0 served as the student model for DR severity classification using the Asia Pacific tele-ophthalmology society (APTOS) 2019 dataset of 3,662 images across five severity levels. The model achieved an accuracy of 95.39%, precision of 95.43%, recall of 95.39%, and an F1-score of 95.37%, demonstrating both high accuracy and computational efficiency.
Methods
DR can be divided into two stages: Proliferative DR (PDR), which is more advanced and is characterized by the development of new, aberrant blood vessels on the retina, and non-proliferative DR (NPDR), which is an early stage characterized by microaneurysms and retinal hemorrhages as shown in Figure 1.
An input retinal image is used to generate a feature vector for the neural network. In the testing phase, a network is built using a wide variety of retinal images to effectively determine if a person has diabetes. To function, the neural network needs to go through two stages: training and testing. Phase segmentation and information extraction are followed by the use of neural networks to identify diabetic retinal disease. Finding features of blood vessels, optical disks, and damage areas is the main goal of diagnosing diabetic retinal illness. The automation of the process necessitates a sophisticated system capable of managing it efficiently. In order to achieve the goals, this work used a CNN with an ANN model. CNN is a widely used DL architecture in computers. The subfield of computer vision in AI enables a computer to comprehend and evaluate visual information, such as images. In ML, ANNs perform exceptionally well and are extensively utilized across various types of datasets that include text, audio, and images. Recurrent neural networks, particularly LSTMs, are used to estimate sequence orders. CNNs are also employed in image classification. In this research, the fundamental elements of a CNN were built. Three different sorts of layers are commonly found in neural networks:
1) The model receives data via the input layer, and the number of neurons in an image is related to its attributes or total number of pixels in an image.
2) The hidden layer receives data from the input layer. The number of hidden layers can be influenced by the model and the volume of data. Although the number of neurons in each buried layer may vary, overall, neurons outweigh features. By applying an activation function, adding biases, and multiplying the output of the preceding layer by learnable weights, each network layer gains nonlinearity.
3) The output layer transforms the data into a more comprehensible format for probability ratings in each class using a logistic function such as softmax or sigmoid. In the next step, called feedforward, data is entered into the model, and outputs are produced for each layer. An error function, such as mean squared error or cross-entropy loss, is then used to evaluate the network’s performance. This error factor gauges the effectiveness of the network. To reduce loss, backpropagation is applied to the model, and derivatives are calculated.
VGG-16 model
The University of Oxford developed the CNN model known as VGG16. In the top five tests, this model achieves a 93% accuracy rate using 15 million images from 1000 classes in the ImageNet dataset. VGG16 is one of the well-known models used in the results of the imagenet large scale visual recognition challenge (ILSVRC). This model performs better than AlexNet by eliminating large kernel-sized filters and replacing them with a large number of smaller 3×3 kernel-sized filters. The VGG16 model was trained using the Titan Black GPU from NVIDIA. The architecture of VGG16 is simplified and layered, including all the layers, their input and output sizes, and other architectural characteristics. In VGG16, the number 16 indicates the total number of layers whose weights can be trained. The weights of the thirteen convolutional layers can be altered during training, allowing for the adjustment of two FC layers and one dense layer.
An RGB image with a fixed 224×224 pixel size is fed into the convolution phase. A sequence of convolutional layers, each using filters with a 33 receptive field, is used to convolve with an input image. In one of the settings, eleven convolution filters are used. The input channels of this filter are linearly altered and the activation process is carried out utilizing the non-linear function RELU. The convolution stage is performed with a fixed pixel of 1. Convolutional spatial padding is meticulously calibrated to preserve the spatial resolution after convolution. For 33 convolutions, we can maintain the spatial resolution after the convolution is complete using a one-pixel padding. Five max pooling layers are used following multiple convolutional layers. For the max pooling operation, a window measuring 224 pixels by 224 strides is utilized. The convolutional layer stack is followed by three FC layers. There are 4096 units in each of the first two FC-connected tiers. The third FC layer has 1000 units because this model must categorize 1000 different classes. The output of the penultimate layer in many multilayer neural networks consists of real-valued scores. However, real-valued scores can be challenging to work with and scale appropriately. In recent years, DR has become the most prevalent type of this illness.
In this research, the traditional VGG-16 architecture was altered to work better for processing the retinal fundus images. To reduce overfitting and computational complexity, optimized dense layers with fewer neurons replaced the last FC layers. Convolutional blocks were followed by batch normalization and dropout layers to enhance training stability and generalization. Experimental trials were also conducted to fine-tune the optimizer parameters and learning rate to achieve optimal convergence. To detect DH, the modified VGG-16 model was designed to capture both local and global retinal characteristics.
The development of certain retinal hemorrhages may result from the increased fluid and reduced blood flow that enter the eye through the retina’s compromised blood vessels as diabetes worsens. Hemorrhages in the retina could be a sign of an uncontrolled ocular illness or a systemic ailment. One crucial ocular diagnostic sign of a systemic vascular illness is retinal hemorrhages. The size, depth, and pattern of the hemorrhages allow us to make informed guesses regarding the potential underlying cause. Retinal hemorrhages require a multidisciplinary team to identify and treat.
In the present study, the retinal images were classified as DH in the categories of severe, mild, moderate, and no DH based on their severity stages. Both the DHs and normal retinal images as shown in Figure 4 a and b.
The primary goal of the current study was to detect dynamic DHs using dynamic foam analyzer inline photometric stereo imaging, which helps to improve the accuracy of early diagnosis. The image abnormalities, which include blood vessels and hemorrhages, are shown in Figure 5.
Preprocessing stage
The suggested method was assessed using 1928 images for testing and 3662 images for training from the APTOS database. Figure 7 shows sample retinal fundus images from the APTOS and DDR datasets.
Image resizing
To ensure a uniform input size that works with DL systems, all retinal images were downsized to 224 by 224 pixels. For this size, an empirical selection was determined following size normalization. For effective analysis and model training, it is essential to maintain consistency in image dimensions across the dataset.
Figure 8 shows a sample of 15 retinal fundus images in varying sizes.
Contrast normalization: To increase contrast, each pixel’s neighborhood mean is subtracted, and the result is divided by the range of pixel values. This process emphasizes subtle retinal characteristics. To address poor contrast caused by glare or uneven lighting, pixel intensity levels are standardized to a defined range.
Gaussian blur: To reduce noise and smooth out images, a linear filter called a Gaussian filter—also referred to as a Gaussian blur [27] was employed. This windowed filter is named after Carl Gauss. The bell-function, often known as the Gaussian distribution, is used to compute the weighted average. It can be applied to spatial issues in one and two dimensions. The cutoff frequency (Fc) of the filter is determined by dividing the sample rate (Fs) by the standard deviation (σ). The following Equations 1 and 2 provide the relationships.
The 1D Gaussian filter is provided using the following equation:
Where ‘G(x)’ is the Gaussian (normal) distribution function, ‘x=0’ is the input pixel intensity or variable under consideration, ‘σ=0’ is standard deviation, which controls the spread (width) of the Gaussian curve, ‘e’ is Euler’s number (the base of the natural logarithm), and ‘π’ is a mathematical constant. This distribution produces a surface with outlines represented as Gaussian-distributed concentric circles extending outward from the center when applied to two-dimensional images.
Image after noise elimination: To improve the clarity of the image’s key characteristics, filtering techniques are usually used to eliminate any leftover noise and artifacts.
Final pre-processed image: The final image utilized for analysis or model training is the one that has undergone all preprocessing procedures. As seen in Figure 9, it is a standardized, noise-free, and cleaned version of the original image that is prepared for additional processing or categorization.
Simulation process
Green channel extraction, contrast enhancement, CNN-based segmentation, training model DL feature extraction
The intrinsic low contrast of retinal fundus images necessitates the improvement of contrast. In order to identify the region of interest (ROI), color input images were converted to the green channel in Figure 10, which offers the highest contrast between exudates, blood vessels, hemorrhages, and the optic disc, making white lesions appear bright and red lesions appear dark.
Results
Testing & validation stage
Training models
The evaluation criteria for the trial are described in detail below. The analysis of results, which is conducted in the manner outlined, will be discussed in the next section.
Phase 1: In phase 1, the number of iterations in the model was examined. The following tables display the combinations selected for each pooling along with the accuracy levels tested throughout a variety of iterations. The varying accuracy values for max pooling with various parameters are shown in Table 1.
Accordingly, Tables 2, 3, and 4 present the results for min pooling, average pooling, and max-min pooling.
Phase 2: Using 1,500 iterations, the previously indicated combinations are revisited, and the outcomes are analyzed. The results for various pooling methods, including max, min, average, and max-min, are shown in Tables 5, 6, 7, and 8, which compare the accuracy calculated using 1,500 iterations to that calculated using fewer than 100 iterations.
Phase 3: Max pooling, average pooling, and max-min pooling are the three combinations of pooling techniques that work best for this model and dataset. To develop a more suitable model with higher accuracy values, these combinations as mentioned in Table 9, can also be used in conjunction with hybridization or optimization techniques.
Table 10 presents a quantitative comparison of our proposed system with other methods, demonstrating that our method outperforms the other algorithms even when dealing with large datasets.
With an average accuracy of 93.26±0.48% and a 95% CI; 92.66%, 93.86%, the proposed model demonstrated reliable performance over several runs.
The accuracy determined using 1500 iterations is contrasted with that obtained from fewer than 100 iterations. It is evident that certain accuracy values increase as the number of iterations grows. The three pooling technique combinations selected for this model and dataset are max pooling, average pooling, and max-min pooling.
Outcomes
The proposed research used CNN image classification, with the leaky rectified linear unit (LReLu) turned out to be the most efficient activation function; tanh function and rectified linear unit (ReLU) also performed well in certain combinations.
Adaptive moment estimation (Adam-50%) and adaptive delta (Adadelta-40%) optimizers provided good accuracy values in CNN cases.
The results from the CNN show learning rates of 0.0001 and 0.001, respectively, which produce better accuracy.
To facilitate effective training, a batch size of 32 was employed. The model was trained over 50 epochs to allow for convergence without overfitting. A dropout rate of 0.5 was used to randomly deactivate neurons during training to enhance generalization.
This research employed a total of 5590 retinal fundus images. The dataset was split into three categories: 65% for training (3662 images), 15% for validation (811 images), and 20% for testing (1117 images). This division was done to guarantee balanced representation and accurate model evaluation.
Several pre-processing techniques, such as scaling, contrast enhancement, and noise reduction, were applied to the images before training in order to enhance the visibility of retinal characteristics, like hemorrhages and micro-aneurysms. In order to preserve consistent pixel intensity across samples, data normalization was used. To reduce overfitting and enhance model generalization, data augmentation methods, including rotation, flipping, and scaling, were applied to the training set. To guarantee equitable learning across all severity levels, the dataset was thoroughly analyzed for class imbalance. When imbalances were found, strategies, such as class-weight correction and oversampling of minority classes were used. To achieve the best results, the RF algorithm was used as the main classifier, with the cross entropy loss function and ReLU activation being used as activation methods to improve nonlinear feature learning and guarantee effective gradient flow during model training. The suggested DL model for bleeding detection improved accuracy for the datasets and parameters as shown in Table 11.
Hardware configuration
Processor: Intel Core i5; 11th Generation @ 2.40 GHz, GPU: NVIDIA GeForce GTX 1650 (4 GB VRAM); RAM: 8 GB DDR4.
Operating system: Windows 10 (64-bit). Deep learning framework: Tensor flow 2.10 with Keras. Training time: Approximately 70–80 seconds per epoch, with a total training duration of about 1 hour for 50 epochs.
Software tools
An Intel Core i7 processor, 16 GB of RAM, and an NVIDIA GeForce GTX 1660 Ti GPU running Windows 10 (64-bit) were used. Python 3.8 was used to develop the proposed model, which included DL and ML libraries for image preprocessing, feature extraction, and classification, including TensorFlow, Keras, scikit-learn, OpenCV, and NumPy.
Classification of DR using ML
The different stages of eye disease were classified using several ML algorithms, such as LR, SVM, and RF to detect and categorize DH, as shown in Figure 14.
Hemorrhage detection
The detection scheme for hemorrhage consisted of four stages:
Digitalization of image, hemorrhage detection, false positive in blood vessel elimination technique, feature analysis.
Fundus images used in ophthalmology to visualize the retina frequently exhibited hue shifts due to the flash light. Brightness correction balanced the intensity across the image, whereas gamma correction adjusted the image contrast in a nonlinear manner (0.5 to 3), increasing specific details for examination in fundus imaging.
Histogram stretching remapped the intensity values of pixels, bringing the lowest value closer to 0 (black) and the maximum value closer to 255 (white). When the green channel was employed solely for fundus image feature extraction, an RGB retinal image gained contrast. To make the relevant features stand out against the background, adaptive histogram equalization was applied. A 3×3 median filter was used to reduce random noise in the images.
The bounding box technique was used to reduce false positive blood vessels. The ratio of each segment’s main axis length to minor axis length was computed, and those with greater values (>1.57) were removed. The hemorrhages were identified, and their density was determined by counting the number of white pixels in the images, as shown in Figure 15.
The RF model performed best among all the classifiers assessed, successfully diagnosing PDR with an accuracy of 93.2%, precision of 0.93, sensitivity of 0.92, and specificity of 0.94. In comparison, the SVM and logistic regression models achieved accuracies of 84.1% and 76.7%, respectively. Because RF is an ensemble model that successfully decreases variance and overfitting and can capture complex non-linear interactions, it outperformed the other models. Our findings suggest that random forest (RF) offers a more reliable and flexible framework for the classification of DR, as shown in Table 13.
In Table 14, the mean accuracy, standard deviation, and 95% CI were used to assess the performance metrics of three classifiers: RF, SVM, and LR.
In comparison to the other techniques, the RF classifier demonstrated the highest mean accuracy (93.2%) with the least amount of fluctuation, demonstrating the stability and durability of the model. The Table 15 represents the classes over the available dataset to classify the percentage of correct classification.
Stage-by-stage sample images from the APTOS dataset are displayed in the Figure 16.
Discussion
The percentage of correct classifications across different stages is shown in Figure 17, which displays the validation of test images by contrasting the actual input images with the anticipated output images.
The training versus validation loss is shown in Figure 19.
A model’s performance over several thresholds is graphically represented by the receiver operating characteristic curve (ROC). The true positive rate (TPR) and false positive rate (FPR) are computed for every threshold or at particular intervals, and the TPR is plotted against the FPR for all, as illustrated in Figure 20.
Varying illumination, image quality, and lesion size across samples may have contributed to inconsistent feature representations. Future research could implement deep feature extraction techniques, ensemble learning approaches, or class-specific data augmentation strategies to improve class separability and overall ROC performance.
As shown in Figure 21a and b, the confusion matrix for the APTOS datasets further demonstrated the performance of our suggested method by highlighting the precise prediction of different DR stages.
Conclusion
A VGG16-based CNN model can detect retinal hemorrhages from the APTOS dataset with an impressive accuracy of 93.26%. The experimental results showed that the Leaky ReLU activation function improves model performance for image classification, whereas the Adam and Adadelta optimizers consistently outperform CNN-based learning. Furthermore, conventional ML models, such as RF, SSM, and LR were successfully used to classify multi-stage DR, achieving an accuracy of 92.4% in recognizing dynamic imaging DHs. The findings can be further expanded using new DL architectures, like vision transformers (ViT) or hybrid CNN-Transformer networks, which provide better global context and feature extraction for subtle lesion identification. Self-supervised learning applied to large-scale unlabelled retinal datasets can increase model generalization and eliminate the need for manual labelling. The future scope of the research can be extended by enhancing model interpretability through the use of explainable AI (XAI) techniques, which would foster clinical trust and enable ophthalmologists to understand the reasoning behind predictions. Enhancing clinical applications and diagnostic interpretability will require integrating multimodal data fusion (fundus and OCT images), explainable AI algorithms, and uncertainty quantification. The clinical use of the suggested automated detection method in DR screening programs appears to have a promising future. The system’s ability to automatically identify early-stage DH lesions in retinal fundus images can help ophthalmologists prioritize high-risk patients, enabling prompt diagnosis and treatment. This method not only reduces the workload for medical professionals but also makes screening more accessible in settings with limited resources or in primary healthcare. Furthermore, improving the model for real-time or edge deployment will make scalable screening solutions possible in remote and resource-constrained settings. Together, these advancements have the potential to result in a more robust, generalizable, and clinically reliable system for automated DR diagnosis and grading.
Limitations of the study
The current study has significant limitations, even though it shows encouraging findings in the automated detection of DH for the early diagnosis of DR. First, the APTOS dataset was used for the experimental evaluation, which would restrict the model’s applicability to other datasets or clinical situations with various imaging conditions, camera settings, and demographic variety. Second, the research mostly concentrated on identifying a single lesion type, DH, without taking into account additional pathological characteristics that are necessary for thorough DR grading, such as microaneurysms, exudates, and neovascularization. Additionally, the model’s reliability and diagnostic capability have not been verified in extensive prospective trials or real-world clinical settings. Investigating the potential application of this strategy in actual clinical workflows would be beneficial for future research. The model might be used, for example, as a decision-support tool to assist ophthalmologists with patient triage, early identification, and large-scale DR screening. This would alleviate the diagnostic burden and promote teleophthalmology-based screening in environments with limited resources.
Ethical Considerations
Compliance with ethical guidelines
There were no ethical considerations to be considered in this research.
Funding
This research did not receive any grant from funding agencies in the public, commercial, or non-profit sectors.
Authors' contributions
All authors contributed equally to the conception and design of the study, data collection and analysis, interpretation of the results, and drafting of the manuscript. Each author approved the final version of the manuscript for submission.
Conflict of interest
The authors declared no conflicts of interest.
Acknowledgments
The authors express their gratitude to the APTOS dataset providers for making the information utilized in this study publicly available.
References
- Casanova R, Saldana S, Chew EY, Danis RP, Greven CM, Ambrosius WT. Application of random forests methods to diabetic retinopathy classification analyses. Plos One. 2014; 9(6): e98587. [DOI:10.1371/journal.pone.0098587] [PMID]
- Gharaibeh N, Al-Hazaimeh OM, Al-Naami B, Nahar KM. An effective image processing method for detection of diabetic retinopathy diseases from retinal fundus images. International Journal of Signal and Imaging Systems Engineering. 2018; 11(4):206-16. [DOI:10.1504/IJSISE.2018.093825]
- Mane D, Ashtagi R, Jotrao R, Bhise P, Shinde P, Kadam P. Diabetic Retinopathy Detection using Deep Learning. Journal of Electrical Systems. 2023; 19(2). [DOI:10.52783/jes.687]
- Adem K. Exudate detection for diabetic retinopathy with circular Hough transformation and convolutional neural networks. Expert Systems with Applications. 2018; 114:289-95. [DOI:10.1016/j.eswa.2018.07.053]
- Zhang W, Zhong J, Yang S, Gao Z, Hu J, Chen Y, et al. Automated identification and grading system of diabetic retinopathy using deep neural networks. Knowledge-Based Systems. 2019; 175:12-25. [DOI:10.1016/j.knosys.2019.03.016]
- Shanthi T, Sabeenian RS. Modified Alexnet architecture for classification of diabetic retinopathy images. Computers & Electrical Engineering. 2019; 76:56-64. [DOI:10.1016/j.compeleceng.2019.03.004]
- Shankar K, Sait AR, Gupta D, Lakshmanaprabu SK, Khanna A, Pandey HM. Automated detection and classification of fundus diabetic retinopathy images using synergic deep learning model. Pattern Recognition Letters. 2020; 133:210-6. [DOI:10.1016/j.patrec.2020.02.026]
- Gayathri S, Gopi VP, Palanisamy P. A lightweight CNN for Diabetic Retinopathy classification from fundus images. Biomedical Signal Processing and Control. 2020; 62:102115. [DOI:10.1016/j.bspc.2020.102115]
- Chen W, Yang B, Li J, Wang J. An approach to detecting diabetic retinopathy based on integrated shallow convolutional neural networks. IEEE Access. 2020; 8:178552-62. [DOI:10.1109/ACCESS.2020.3027794]
- Pao SI, Lin HZ, Chien KH, Tai MC, Chen JT, Lin GM. Detection of diabetic retinopathy using bichannel convolutional neural network. Journal of Ophthalmology. 2020; 2020(1):9139713. [DOI:10.1155/2020/9139713] [PMID]
- Roychowdhury S, Koozekanani DD, Parhi KK. DREAM: Diabetic retinopathy analysis using machine learning. IEEE Journal of Biomedical and Health Informatics. 2013; 18(5):1717-28. [DOI:10.1109/JBHI.2013.2294635] [PMID]
- Lachure J, Deorankar AV, Lachure S, Gupta S, Jadhav R. Diabetic retinopathy using morphological operations and machine learning. Paper presented at: 2015 IEEE International Advance Computing Conference (IACC). 12 Jun, 2015. IEEE. [DOI:10.1109/IADCC.2015.7154781]
- Tsao HY, Chan PY, Su EC. Predicting diabetic retinopathy and identifying interpretable biomedical features using machine learning algorithms. BMC Bioinformatics. 2018; 19(Suppl 9):283. [DOI:10.1186/s12859-018-2277-0] [PMID]
- Aravind C, Ponnibala M, Vijayachitra S. Automatic detection of microaneurysms and classification of diabetic retinopathy images using SVM technique. International Journal of Computer Applications. 2013; 975(8887):1-5. [DOI:10.5120/11660-7242]
- Saha R, Chowdhury AR, Banerjee S. Diabetic retinopathy related lesions detection and classification using machine learning technology. Cham: Springer International Publishing; 2016. [DOI:10.1007/978-3-319-39384-1_65]
- Kaliannan S, Rengaraj A. Differentiating the presence of brain stroke types in MR images using CNN architecture. Current Medical Imaging. 2024; 20(1):e15734056273238. [DOI:10.2174/0115734056273238231203105157] [PMID]
- Kaliannan S, Rengaraj A, Daniel AP. A novel fusion approach to detect brain tumor using machine learning for MRI images. Traitement du Signal. 2022; 39(4):1363. [DOI:10.18280/ts.390430]
- Bhatkar AP, Kharat GU. Detection of diabetic retinopathy in retinal images using MLP classifier. In: 2015 IEEE International Symposium on Nanoelectronic and Information Systems. 21December, 2015 . IEEE. [DOI:10.1109/iNIS.2015.30]
- Gayathri S, Krishna AK, Gopi VP, Palanisamy P. Automated binary and multiclass classification of diabetic retinopathy using haralick and multiresolution features. IEEE Access. 2020; 8:57497-504. [DOI:10.1109/ACCESS.2020.2979753]
- Mujeeb Rahman KK, Nasor M, Imran A. Automatic screening of diabetic retinopathy using fundus images and machine learning algorithms. Diagnostics. 2022; 12(9):2262. [DOI:10.3390/diagnostics12092262] [PMID]
- Kaliannan S, Rengaraj A. CNN Architecture Based Classification of Hemorrhagic and Ischemic Stroke Using MR Images. Traitement du Signal. 2025; 42(1):87. [DOI:10.18280/ts.420109]
- Narayanan BN, Hardie RC, De Silva MS, Kueterman NK. Hybrid machine learning architecture for automated detection and grading of retinal images for diabetic retinopathy. Journal of Medical Imaging. 2020; 7(3):034501. [DOI:10.1117/1.JMI.7.3.034501] [PMID]
- Srisabarimani K, Arthi R. Segmentation of Ischemic stroke in Brain DWI MRI. Paper presented at: 2024 International Conference on Emerging Systems and Intelligent Computing (ESIC). 9 February, 2024. IEEE. [DOI:10.1109/ESIC60604.2024.10481614]
- Aravindan C, Vasuki R. Detection and classification of early stage diabetic retinopathy using artificial intelligence and image processing. Paper presented at: 2023 International Conference on Intelligent Data Communication Technologies and Internet of Things (IDCIoT). 5 January, 2023. IEEE. [DOI:10.1109/IDCIoT56793.2023.10053477]
- Aravindan C, Felix AJ, Gayathri V, Kiran K, Venkat GV. Retinal vessel classification to predict diabetic retinopathy and retinitis pigmentosa using a deep learning pipeline. AIP Conference Proceedings. 2022; 2405(1):020026. [DOI:10.1063/5.0072436]
- Aravindan C, Vasuki R. A study on improvising early detection of dot hemorrhages in the retina through dynamic image comparison technique. Materials Today: Proceedings. 2023; 81:864-75. [DOI:10.1016/j.matpr.2021.04.268]
- Ramasamy LK, Padinjappurathu SG, Kadry S, Damaševičius R. Detection of diabetic retinopathy using a fusion of textural and ridgelet features of retinal images and sequential minimal optimization classifier. PeerJ Computer Science. 2021; 7:e456. [DOI:10.7717/peerj-cs.456] [PMID]
- Sinclair SH, Schwartz S. Diabetic retinopathy: New concepts of screening, monitoring, and interventions. Surv Ophthalmol. 2024; 69(6):882-92. [DOI:10.1016/j.survophthal.2024.07.001] [PMID]
- Li H, Jia W, Vujosevic S, Sabanayagam C, Grauslund J, Sivaprasad S, et al. Current research and future strategies for the management of vision-threatening diabetic retinopathy. Asia Pac J Ophthalmol. 2024; 13(5):100109. [DOI:10.1016/j.apjo.2024.100109] [PMID]
- Sathiyaseelan R, Ranganathan K, Ramamoorthy R, Pedda Chennaiah M. Haemorrhage diagnosis in colour fundus images using a fast-convolutional neural network based on a modified U-Net. Network. 2025; 36(1):198-219. [DOI:10.1080/0954898X.2024.2310687] [PMID]
- Rautaray J, Ali AB, Kandpal M, Mishra P, Rashid RF, Alimova F, et al. Leveraging FastViT based knowledge distillation with efficientnet-b0 for diabetic retinopathy severity classification. SLAS Tech. 2025; 33:100325. [DOI:10.1016/j.slast.2025.100325]
- García G, Gallardo J, Mauricio A, López J, Del Carpio C. Detection of diabetic retinopathy based on a convolutional neural network using retinal fundus images. Paper presented at: International Conference on artificial neural networks. 2017 September 14; Alghero, Italy. [Link]
- Qureshi I, Ma J, Abbas Q. Diabetic retinopathy detection and stage classification in eye fundus images using active deep learning. Multimed Tools Appl. 2021; 80(8):11691-721. [Link]
- Mumtaz R, Hussain M, Sarwar S, Khan K, Mumtaz S, Mumtaz M. Automatic detection of retinal hemorrhages by exploiting image processing techniques for screening retinal diseases in diabetic patients. Int J Diab Dev Ctries. 2018; 38(1):80-7. [Link]
Type of Study: Orginal Article |
Subject:
● Artificial Intelligence
Received: 2025/08/22 | Accepted: 2025/11/1 | Published: 2025/12/31
Received: 2025/08/22 | Accepted: 2025/11/1 | Published: 2025/12/31
| Rights and permissions | |
 |
This work is licensed under a Creative Commons Attribution-NonCommercial 4.0 International License. |

This is an open access article distributed under the terms of the Creative Commons Attribution License (CC-By-NC), which permits use, distribution, and reproduction in any medium, provided the original work is properly cited and is not used for commercial purposes.
Contact Information